 RSS Feed
 by Calculated Risk on 6/02/2009 08:42:00 AM
Tuesday, June 02, 2009
NY Times: Foreclosures: No End in Sight
NY Times Editorial: Foreclosures: No End in Sight
A continuing steep drop in home prices combined with rising unemployment is powering a new wave of foreclosures. Unfortunately, there’s little evidence, so far, that the Obama administration’s anti-foreclosure plan will be able to stop it.In previous housing busts, foreclosures continued to rise until prices finally bottomed. And prices will fall - and foreclosures rise - for some time. There is no end in sight.
...
One of the biggest problems is that the plan focuses almost entirely on lowering monthly payments. But overly onerous payments are only part of the problem. For 15.4 million “underwater” borrowers — those who owe more on their mortgages than their homes are worth — a lack of home equity puts them at risk of default, even if their monthly payments have been reduced. They have no cushion to fall back on in the event of a setback, like job loss or illness.
...
There will be no recovery until there is a halt in the relentless rise in foreclosures. Foreclosures threaten millions of families with financial ruin. By driving prices down, they sap the wealth of all homeowners. They exacerbate bank losses, putting pressure on the still fragile financial system. Lower monthly payments are a balm, but they are no substitute for home equity. And until more Americans can find a good job and a steady paycheck, the number of foreclosures will continue to rise.
Late Night Futures
by Calculated Risk on 6/02/2009 12:22:00 AM
Here is an open thread for discussion.
The automakers will release May sales results Tuesday. There is a good chance that sales in May were below the February 9.3 million seasonally adjusted annual rate (SAAR). To find a lower sales month, we need to go back to December 1981: 9.05 million SAAR. May could be the lowest sales month since 1970 ...
U.S. futures are flat.
Futures from barchart.com
Bloomberg Futures.
CBOT mini-sized Dow
CME Globex Flash Quotes
And the Asian markets are almost up 1% or so.
Best to all.
Monday, June 01, 2009
GM News
by Calculated Risk on 6/01/2009 09:30:00 PM
Just some excerpts ...
From the WSJ: Filings Reveal Depth of Problems
General Motors Corp.'s $82.2 billion in assets and $172 billion in liabilities spell out the extent of its problems and sheer breadth of the 101-year-old giant's bankruptcy.More details from Bloomberg: GM Files Bankruptcy to Spin Off More Competitive Firm
In a torrent of filings at the U.S. Bankruptcy Court in Manhattan, GM's mind-numbing scale is evident: It has 463 subsidiaries and has built 450 million cars and trucks over the years. It employs 235,000 people worldwide. This includes 91,000 in the United States, which it pays $476 million each month, and 493,000 retirees with various benefits. It spends $50 billion a year buying parts and services from 11,500 vendors in North America.
From the WSJ: GM to Announce Tentative Hummer Sale
General Motors Corp., fresh off filing for bankruptcy protection Monday, will start its second day of court proceedings by announcing the tentative sale of the Hummer brand ...Auto sales for May will be announced tomorrow. The bankruptcy of Chrysler - and now GM - will probably depress auto sales further for a few months, although probably not by much.
Property tax relief in Los Angeles
by Calculated Risk on 6/01/2009 06:29:00 PM
From the LA Times: Property tax relief coming for more than 330,000 L.A. County homeowners
... The Los Angeles County assessor’s office this morning announced that it has finished an automatic review of assessments for 473,000 homes purchased between July 1, 2003 and June 30, 2008 -- which account for about 28% of homes countywide.According to the Case-Shiller home price index, prices in Los Angeles are back to the July 2003 level, and I'd think that just about every home purchased between July 2003 and July 2008 would be worth less today - not just 70%. Unfortunately for homeowners - and tax collectors - prices will probably fall further.
County officials reduced assessments on about 70% of properties reviewed. Homeowners getting a break should soon get a letter in the mail. The average property tax savings is $1,400 for owners of single family homes and $1,100 for condominium owners, county officials said.
Those receiving reductions included owners of 256,000 single family homes and 77,000 condo owners. The average reduction in value was $126,000 for single family homes; $96,000 for condos.
The reduction in assessments means a loss of $440 million in tax revenue, a 1% drop county officials anticipated in last month’s proposed budget, said Assessor Rick Auerbach.
The good news is only 28% of all homes in Los Angeles county were purchased during the height of the bubble! Of course other homeowners probably used the Home ATM (cash out refinance or HELOC) and are underwater too.
Fed Outlines TARP Repayment Rules
by Calculated Risk on 6/01/2009 04:28:00 PM
Note: this is for the 19 largest banks.
From the Fed:
The Federal Reserve Board on Monday outlined the criteria it will use to evaluate applications to redeem U.S. Treasury capital from the 19 bank holding companies (BHC) that participated in the Supervisory Capital Assessment Program (SCAP).
Redemption approvals for an initial set of these large bank holding companies are expected to be announced during the week of June 8. Applications will be evaluated periodically thereafter. Any banking organization wishing to redeem U.S. Treasury capital must first obtain approval from its primary federal supervisor, which then forwards approved applications to the Treasury Department.
Any BHC seeking to redeem U.S. Treasury capital must demonstrate an ability to access the long-term debt markets without reliance on the Federal Deposit Insurance Corporation's Temporary Liquidity Guarantee Program (TLGP), and must successfully demonstrate access to public equity markets.
In addition, the Federal Reserve's review of a BHC's application to redeem U.S. Treasury capital will include consideration of the following:•Whether a BHC can redeem its Treasury capital and remain in a position to continue to fulfill its role as an intermediary that facilitates lending to creditworthy households and businesses;Finally, all BHCs must have a robust longer-term capital assessment and management process geared toward achieving and maintaining a prudent level and composition of capital commensurate with the BHC's business activities and firm-wide risk profile.
•Whether, after redeeming its Treasury capital, a BHC will be able to maintain capital levels that are consistent with supervisory expectations;
•Whether a BHC will be able to continue to serve as a source of financial and managerial strength and support to its subsidiary bank(s) after the redemption; and
•Whether a BHC and its bank subsidiaries will be able to meet its ongoing funding requirements and its obligations to counterparties while reducing reliance on government capital and the TLGP.
emphasis added
Stock Market Update
by Calculated Risk on 6/01/2009 04:00:00 PM
By popular demand ... Click on graph for larger image in new window.
The first graph shows the S&P 500 since 1990.
The dashed line is the closing price today.
The S&P 500 is up almost 40% from the bottom (267 points), and still off almost 40% from the peak (622 points below the max).
This puts the recent rally into perspective.
Note that the Great Depression crash is based on the DOW; the three others are for the S&P 500.
More on Consumption in April
by Calculated Risk on 6/01/2009 01:18:00 PM
The following graph shows real Personal Consumption Expenditures (PCE) through April (2000 dollars). Note that the y-axis doesn't start at zero to better show the change. Click on graph for larger image in new window.
PCE declined sharply in Q3 and Q4 2008, and rebounded slightly in Q1 2009.
Q2 2009 is off to a weak start, with PCE in April below the levels of Q1. Although it is possible that PCE will pick up in May and June, it seems likely that PCE will be negative in Q2 (although not the cliff diving of the 2nd half of 2008).
Usually PCE and Residential Investment (RI) lead the economy out of recession, and right now both remain weak. As households increase their savings rate to repair their balance sheets, it seems unlikely that PCE will increase significantly any time soon.
Just a reminder - the end to cliff diving is not the same thing as "green shoots".
Construction Spending in April
by Calculated Risk on 6/01/2009 10:17:00 AM
Private residential construction spending is 63.2% below the peak of early 2006.
Private non-residential construction spending is 4.4% below the peak of last September. Click on graph for larger image in new window.
The first graph shows private residential and nonresidential construction spending since 1993. Note: nominal dollars, not inflation adjusted.
Residential construction spending was up slightly in April (compared to March), and nonresidential spending has peaked and will probably decline sharply over the next two years. The second graph shows the year-over-year change for private residential and nonresidential construction spending.
Nonresidential spending is essentially flat on a year-over-year basis, and will turn strongly negative as projects are completed. Residential construction spending is still declining YoY, although the YoY change is starting to be less negative.
As I've noted before, these will probably be two key stories for 2009: the collapse in private non-residential construction, and the probable bottom for residential construction spending. Both stories are just developing ...
From the Census Bureau: April 2009 Construction at $968.7 Billion Annual Rate
Spending on private construction was at a seasonally adjusted annual rate of $657.3 billion, 1.4 percent (±1.3%) above the revised March estimate of $648.2 billion. Residential construction was at a seasonally adjusted annual rate of $249.2 billion in April, 0.7 percent (±1.3%)* above the revised March estimate of $247.4 billion. Nonresidential construction was at a seasonally adjusted annual rate of $408.2 billion in April, 1.8 percent (±1.3%) above the revised March estimate of $400.8 billion.
ISM Manufacturing Shows Contraction in May
by Calculated Risk on 6/01/2009 10:00:00 AM
From the Institute for Supply Management: May 2009 Manufacturing ISM Report On Business®
Economic activity in the manufacturing sector failed to grow in May for the 16th consecutive month, while the overall economy grew for the first time following seven months of decline, say the nation's supply executives in the latest Manufacturing ISM Report On Business®.As noted, any reading below 50 shows contraction, although the pace of contraction has slowed.
...
Manufacturing contracted in May as the PMI registered 42.8 percent, which is 2.7 percentage points higher than the 40.1 percent reported in April. This is the 16th consecutive month of contraction in the manufacturing sector. A reading above 50 percent indicates that the manufacturing economy is generally expanding; below 50 percent indicates that it is generally contracting.
A PMI in excess of 41.2 percent, over a period of time, generally indicates an expansion of the overall economy. Therefore, the PMI indicates growth in the overall economy following seven months of decline, and continuing contraction in the manufacturing sector.
...
"While employment and inventories continue to decline at a rapid rate and the sector continued to contract during the month, there are signs of improvement. May is the first month of growth in the New Orders Index since November 2007, with nine of 18 industries reporting growth. New orders are considered a leading indicator, and the index has risen rapidly after bottoming at 23.1 percent in December 2008. Also, the Customers' Inventories Index remained below 50 percent for the second consecutive month, offering encouragement that supply chains are starting to free themselves of excess inventories as nine industries report their customers' inventories as 'too low'. The prices that manufacturers pay for raw materials and services continued to decline, but at a slower rate than in April."
emphasis added
Consumption Down, Saving Rate Increases in April
by Calculated Risk on 6/01/2009 08:44:00 AM
From the BEA: Personal Income and Outlays, April 2009
Personal income increased $58.2 billion, or 0.5 percent, and disposable personal income (DPI) increased $121.8 billion, or 1.1 percent, in April, according to the Bureau of Economic Analysis. Personal consumption expenditures (PCE) decreased $5.4 billion, or 0.1 percent. ... The pattern of changes in income reflect, in part, the pattern of reduced personal current taxes and increased government social benefit payments associated with the American Recovery and Reinvestment Act of 2009.A few points:
...
Real PCE -- PCE adjusted to remove price changes -- decreased 0.1 percent in April, compared with a decrease of 0.3 percent in March.
...
Personal saving as a percentage of disposable personal income was 5.7 percent in April, compared with 4.5 percent in March.
 Click on graph for large image.
This graph shows the saving rate starting in 1959 (using a three month centered average for smoothing) through the April Personal Income report. The saving rate was 5.7% in April. (5.1% with average)
The saving rate was boosted by the stimulus package, but this suggests households are saving substantially more than during the last few years (when the saving rate was close to zero). The saving rate will probably continue to rise (an aging population usually pushes the saving rate higher) and a rising saving rate will repair household balance sheets, but this will also keep pressure on personal consumption.
Sunday, May 31, 2009
Jim the Realtor: Check out this Backyard!
by Calculated Risk on 5/31/2009 11:34:00 PM
Another video from Jim ... words can't describe this backyard and other, uh, "features" ... although I think the "long jump" pit is for horseshoes.
GM to file Bankruptcy Monday Morning
by Calculated Risk on 5/31/2009 06:47:00 PM
From the Detroit News: GM bankruptcy filing expected 6 a.m. Monday (ht jb)
The Obama administration will name a veteran turnaround expert as chief restructuring officer for General Motors Corp., which plans to file for bankruptcy protection about 6 a.m. Monday in New York ... Al Koch, a managing director at AlixPartners LLP, will be named chief restructuring officer Monday, a government official familiar with the matter said, and will help to wind down GM's "bad" assets that it plans to leave behind in bankruptcy.The WSJ says 8 AM.
Alt-A Foreclosures in Sonoma
by Calculated Risk on 5/31/2009 03:30:00 PM
The Press Democrat: Alt-A loans: Second wave of foreclosures ahead (ht Atrios) reports that there are 18,000 Alt-A mortgages in Sonoma County (about 18 percent of all mortgages). This is a larger percentage of mortgages in Somona County than for subprime - which accounted for about 10 percent of all mortgages in the county at the peak.
According to the story - using First American CoreLogic as a source - about two-thirds of these Alt-A loans will see a significant payment increase over the next few years, with recasts peaking in 2011.
First, I strongly recommend everyone read Tanta's Reflections on Alt-A
Alt-A is sort of a weird mirror-image of subprime lending. If subprime was traditionally about borrowers with good capacity and collateral but bad credit history, Alt-A was about borrowers with a good credit history but pretty iffy capacity and collateral. That is to say, while subprime makes some amount of sense, Alt-A never made any sense. It is a child of the bubble.There is much more ...
...
Alt-A ... overwhelmingly involved the kind of "affordability product" like ARMs and interest only and negative amortization and 40-year or 50-year terms that "ramps" payment streams. But it doesn't do this in order to help anyone "catch up" on arrearages; people with good credit don't have any arrearages. Alt-A was and has always been about maximizing consumption, whether of housing or of all the other consumer goods you can spend "MEW" on. If subprime was supposed to be about taking a bad-credit borrower and working him back into a good-credit borrower, Alt-A was about taking a good-credit borrower and loading him up with enough debt to make him eventually subprime.
Second, most of those Alt-A loans were in mid-to-high priced areas. So the foreclosure crisis will now be moving up the value chain. But unlike the low priced areas where there are more potential first time buyers and cash flow investors waiting for prices to fall, demand in mid-priced areas usually comes from move up and move across buyers. Since a majority of the sellers in low priced areas are lenders (DataQuick reported 57.1 percent of sales in Sonoma in March were foreclosure resales), there will be few buyers for these Alt-A foreclosures.
NY Times: The Fall of the Mall
by Calculated Risk on 5/31/2009 12:16:00 PM
The NY Times has a graphic of the performance of a theoretical mall: The Fall of the Mall (ht Ann, Pat). 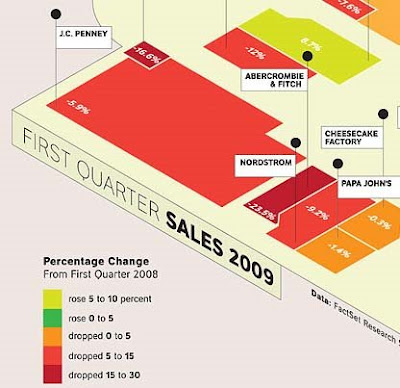 Click on graphic for complete image.
The graphic compares the performance of a number of retailers from Q1 2008 to Q1 2009.
The best performers are a dollar store, a movie theater and a pharmacy.
The worst performers are Saks, Abercrombie & Fitch, Bebe and some others.
This is a theoretical mall where all the retailers are still in business. In reality many stores are vacant, and many malls are dead or dying. See the WSJ: Recession Turns Malls Into Ghost Towns
One industry rule of thumb holds that any large, enclosed mall generating sales per square foot of $250 or less -- the U.S. average is $381 -- is in danger of failure. By that measure, [Eastland Mall in Charlotte] is one of 84 dead malls in a 1,032-mall database compiled by Green Street.
GM Bondholders Agree to Debt-for-Equity, Hummer Sale Near
by Calculated Risk on 5/31/2009 10:12:00 AM
From the NY Times: G.M. Bankruptcy Plan Clears Bondholder Hurdle
General Motors’ bondholders finished voting Saturday on the company’s plan to exchange their debt for an ownership stake ... Bondholders with slightly more than 50 percent of G.M.’s $27.2 billion in bond debt agreed to support the plan by the deadline of 5 p.m ... Bondholders would initially get a 10 percent stake, along with warrants for 15 percent.And the WSJ is reporting that the sale of GM's Hummer brand is near - without details.
Saturday, May 30, 2009
Report: GM Bankruptcy on Monday
by Calculated Risk on 5/30/2009 10:16:00 PM
From the WaPo: GM Bondholders Vote on Sweetened Deal
GM is now speeding toward its day of reckoning, as the automaker will likely file for bankruptcy protection tomorrow.From the WSJ: GM Awaits Fate as Bondholder Votes Are Tallied
General Motors Corp. on Saturday readied for a bankruptcy filing ... The company, the U.S. Treasury and an ad hoc committee representing large institutional creditors all declined comment after the expiration of a 5 p.m. EDT deadline for acceptance of the exchange. However, one member of the ad hoc committee said Saturday that the sweetened deal was expected to be approved by a majority of noteholders ...
GM's board was meeting ahead of an expected announcement on Monday that the auto maker will seek Chapter 11 protection, and GM Chief Executive Fritz Henderson scheduled a news conference Monday in New York.
May Economic Summary in Graphs
by Calculated Risk on 5/30/2009 05:33:00 PM
Here is a collection of real estate and economic graphs for data released in May ...
Note: Click on graphs for larger image in new window. For more info, click on link below graph to original post.
 New Home Sales in April (NSA)
The first graph shows monthly new home sales (NSA - Not Seasonally Adjusted).
Note the Red columns for 2009. This is the second lowest sales for April since the Census Bureau started tracking sales in 1963. (NSA, 33 thousand new homes were sold in March 2009; the record low was 32 thousand in April 1982).
From: New Home Sales Flat in April
 New Home Sales in April
This graph shows shows New Home Sales vs. recessions for the last 45 years. New Home sales have fallen off a cliff.
"Sales of new one-family houses in April 2009 were at a seasonally adjusted annual rate of 352,000, according to estimates released jointly today by the U.S. Census Bureau and the Department of Housing and Urban Development.
This is 0.3 percent (±14.5%)* above the revised March rate of 351,000, but is 34.0 percent (±11.0%) below the April 2008 estimate of 533,000."
From: New Home Sales Flat in April
 New Home Months of Supply in April
There were 10.1 months of supply in April - significantly below the all time record of 12.4 months of supply set in January.
"The seasonally adjusted estimate of new houses for sale at the end of April was 297,000. This represents a supply of 10.1months at the current sales rate.
From: New Home Sales Flat in April
 Existing Home Sales in April
 This graph shows existing home sales, on a Seasonally Adjusted Annual Rate (SAAR) basis since 1993.
Sales in April 2009 (4.68 million SAAR) were 2.9% higher than last month, and were 3.5% lower than April 2008 (4.85 million SAAR).
It's important to note that close to half of these sales were foreclosure resales or short sales. Although these are real transactions, this means activity (ex-distressed sales) is under 3 million units SAAR.
From: Existing Home Sales in April
 Existing Home Inventory April
This graph shows nationwide inventory for existing homes. According to the NAR, inventory increased to 3.97 million in April. The all time record was 4.57 million homes for sale in July 2008. This is not seasonally adjusted.
Typically inventory increases in April, and then really increases over the next few months of the year until peaking in the summer. This increase in inventory was probably seasonal, and the next few months will be key for inventory.
Also, many REOs (bank owned properties) are included in the inventory because they are listed - but not all. Recently there have been stories about a substantial number of unlisted REOs - this is possible.
From: Existing Home Sales in April
 Existing Home Inventory April, Year-over-Year Change
This graph shows the year-over-year change in existing home inventory.
If the trend of declining year-over-year inventory levels continues in 2009 that will be a positive for the housing market. Prices will probably continue to fall until the months of supply reaches more normal levels (in the 6 to 8 month range comparted to the current 10.2 months), and that will take some time.
From: More on Existing Home Sales and Inventory
 Case Shiller House Prices for March
This graph shows the nominal Composite 10 and Composite 20 indices (the Composite 20 was started in January 2000).
The Composite 10 index is off 32.4% from the peak, and off 2.0% in March.
The Composite 20 index is off 31.4% from the peak, and off 2.2% in March.
From: Case-Shiller: Prices Fall Sharply in March
 NAHB Builder Confidence Index in May
This graph shows the builder confidence index from the National Association of Home Builders (NAHB).
The housing market index (HMI) increased to 16 in May from 14 in April from. The record low was 8 set in January.
The increase in April and May followed five consecutive months at either 8 or 9.
From: NAHB: Builder Confidence Increases in May
 Architecture Billings Index for April
"After an eight-point jump in March, the Architecture Billings Index (ABI) fell less than a full point in April. As a leading economic indicator of construction activity, the ABI reflects the approximate nine to twelve month lag time between architecture billings and construction spending. The American Institute of Architects (AIA) reported the April ABI rating was 42.8, down from the 43.7 mark in March. This was the first time since August and September 2008 that the index was above 40 for consecutive months, but the score still indicates an overall decline in demand for design services (any score above 50 indicates an increase in billings)...."
From: Architecture Billings Index Steady in April
 Housing Starts in April
Total housing starts were at 458 thousand (SAAR) in April, the all time record low. The previous record low was 488 thousand in January (the lowest level since the Census Bureau began tracking housing starts in 1959).
Single-family starts were at 368 thousand (SAAR) in April; just above the revised record low in January (357 thousand).
From: Housing Starts at Record Low in April
 Construction Spending in March
This graph shows private residential and nonresidential construction spending since 1993. Note: nominal dollars, not inflation adjusted.
Private residential construction spending is 61.8% below the peak of early 2006.
Private non-residential construction spending is 5.7% below the peak of last September.
From: Private Construction Spending Declines Slightly in March
 April Employment Report
This graph shows the unemployment rate and the year over year change in employment vs. recessions.
Nonfarm payrolls decreased by 539,000 in April. March job losses were revised to
699,000. The economy has lost almost 4 million jobs over the last 6 months, and over 5.7 million jobs during the 16 consecutive months of job losses.
The unemployment rate rose to 8.9 percent; the highest level since 1983.
Year over year employment is strongly negative (there were 5.2 million fewer Americans employed in Apr 2009 than in Apr 2008).
From: Employment Report: 539K Jobs Lost, 8.9% Unemployment Rate
 April Retail Sales
This graph shows the year-over-year change in nominal and real retail sales since 1993.
On a monthly basis, retail sales decreased 0.4% from March to April (seasonally adjusted), and sales are off 11.4% from April 2008 (retail and food services decreased 10.1%).
From: Retail Sales Decline in April
 LA Port Traffic in April
This graph shows the loaded inbound and outbound traffic at the port of Los Angeles in TEUs (TEUs: 20-foot equivalent units or 20-foot-long cargo container). Although containers tell us nothing about value, container traffic does give us an idea of the volume of goods being exported and imported.
Inbound traffic was 21.5% below April 2008.
Outbound traffic was 18.3% below April 2008.
There has been some slight recovery in exports the last two months (the year-over-year comparison was off 30% from December through February). But this is the 2nd worst YoY comparison for imports - only February was worse, and that might have been related to the Chinese New Year. So imports from Asia appear especially weak.
From: LA Area Port Traffic
 U.S. Imports and Exports Through March
This graph shows the monthly U.S. exports and imports in dollars through March 2009.
Both imports and exports declined in March, although it appears the cliff diving in trade might be over.
On a year-over-year basis, exports are off 17.4% and imports are off 27%!
From: U.S. March Trade Deficit: $27.6 billion
 April Capacity Utilization
This graph shows Capacity Utilization. This series is at another record low (the series starts in 1967).
The Federal Reserve reported that "Industrial production decreased 0.5 percent in April after having fallen 1.7 percent in March. Production in manufacturing declined 0.3 percent in April and was 16.0 percent below its recent peak in December 2007. The decreases in manufacturing in April remained broadly based across industries."
From: Industrial Production Declines, now 16% Below Peak
 Vehicle Miles driven in March
The first graph shows the annual change in the rolling 12 month average of U.S. vehicles miles driven. Note: the rolling 12 month average is used to remove noise and seasonality.
By this measure, vehicle miles driven are off 3.3% Year-over-year (YoY); the decline in miles driven was worse than during the early '70s and 1979-1980 oil crisis. However miles driven - compared to the same month of 2008 - has only been off about 1% for the last couple months.
From: D.O.T.: U.S. Vehicle Miles off 1.2% YoY in March
 Unemployment Claims
This graph shows weekly claims and continued claims since 1971.
Continued claims are now at 6.79 million - an all time record. This is 5.1% of covered employment.
Note: continued claims peaked at 5.4% of covered employment in 1982 and 7.0% in 1975. So this isn't a record as a percent of covered employment.
From: Unemployment Claims: Continued Claims at Record 6.79 Million
 Restaurant Performance Index for April
"The outlook for the restaurant industry grew more optimistic in April, as the National Restaurant Association’s comprehensive index of restaurant activity registered its fourth consecutive monthly gain. The Association’s Restaurant Performance Index (RPI) – a monthly composite index that tracks the health of and outlook for the U.S. restaurant industry – stood at 98.6 in April, up 0.8 percent from March, its highest level in 11 months."
From: Restaurant Performance Index Improves in April
 Philly Fed State Conincident Indicators for April
Here is a map of the three month change in the Philly Fed state coincident indicators. All 50 states are showing declining three month activity.
This is the new definition of "Red states" and this is what a widespread recession looks like based on the Philly Fed states indexes.
"Over the past three months, the indexes decreased in all 50 states, for a three-month diffusion index of -100."
From: Philly Fed State Coincident Indexes
U.K.: FSA Aware of Northern Rock Risks in 2004
by Calculated Risk on 5/30/2009 12:58:00 PM
From the Financial Times: War game saw run on Rock
Banking regulators identified Northern Rock as the weak link in Britain's banking system during secret "war games" held as long ago as 2004, the Financial Times has learned.File under "hoocoodanode?"
The risk simulation planning, conducted by the Financial Services Authority, the Bank of England and the Treasury, made clear the systemic risks posed by Northern Rock's business model, and its domino effect on HBOS, then the UK's largest mortgage lender.
The revelation is at odds with government officials' insistence that no one could have foreseen the September 2007 collapse of Northern Rock or the subsequent rescue of HBOS, which was sold to Lloyds Bank.
Even though the exercise revealed the banks' vulnerability, the regulators concluded they could not force the lenders to change their practices, according to several people familiar with the matter.
CRE: See-Through Buildings on the Beltway
by Calculated Risk on 5/30/2009 08:53:00 AM
From the Washington Business Journal: Commercial foreclosures start to spread across Northern Va. (ht Frank)
Anyone who follows the commercial real estate market knows there are buildings in trouble throughout Washington, but as one drives along the Dulles Toll Road or Route 28, it’s hard to miss the signs of distress. “See-through buildings” dot the corridor, bereft of the interior office walls that don’t show up until a tenant does.Vacant buildings. Prices plummeting. Massive refinancing needs of properties with negative equity. Sounds familiar ...
In recent weeks, at least two lenders have given up the waiting game and taken the keys and the title back from the owners: Lincoln Park III and Monument III.
More than 50 office buildings stand empty or virtually empty in Northern Virginia, with 46 lying beyond the Beltway.
...
Some commercial buildings in the Washington region have lost as much as half their value but, on average, his clients are asking tax authorities for 20- to 25-percent reductions in assessed value, said [David Levy, a co-founder of McLean-based Value Advisors Inc., which represents property owners in tax appeals.] said.
...
By next year, a massive wave of properties financed in 2005 through the commercial mortgage-backed securities market will need to find new financing.
U.S. Treasury Estimate: Five Years to Recover $50 Billion GM Outlay
by Calculated Risk on 5/30/2009 12:02:00 AM
From the WaPo: U.S. Hopes To Recoup GM Outlay In 5 Years
The United States would recover most of its planned $50 billion investment in General Motors within five years, according to a preliminary Treasury Department estimate that foresees the company ...
Among the key variables in any such forecast is the number of new cars sold annually in the United States as well as the estimate of GM's share of the market.
During the boom years, the annualized figure for car sales in the United States hovered around 16 million. Recently, it has fallen to between 9 million and 10 million on an annualized basis.
In regulatory filings, GM has estimated that the car market will rebound to 16 million by 2012.
 Click on graph for larger image in new window.
This table from the GM Restructuring Plan (back in February) shows the GM baseline U.S. auto sales forecast and a comparison with J.D. Power and Global Insight forecasts.
Sales will probably be below the Q2 2009 estimate of 10.4 million annual rates since sales in April were at a 9.5 million SAAR - and sales will probably be very weak in May and June with Chrysler and GM in bankruptcy.
 GM expects a modest recovery in sales over the next couple of years - and that seems somewhat reasonable - but it is important to remember that sales during the bubble were inflated as homeowners withdrew equity to buy vehicles. So achieving the levels of the boom years any time soon seems unlikely.
Note: This graph shows U.S. vehicle sales (auto, light truck, heavy truck) since 1967.


