by Calculated Risk on 7/03/2009 01:38:00 PM
Friday, July 03, 2009
U.K.: Britons Pay Down Mortgage Debt in Q1
From the Telegraph: UK homeowners pay back a record £8.1bn of mortgage debt
Britons injected £8.1bn to pay off their mortgage debt in the first three months of 2009, the Bank of England said on Friday ... The figure compares with a £7.7bn injection in the final three months of 2008 ...This is the fourth consecutive quarter with homeowners reducing their mortgage debt in the U.K..
"Sharply falling house prices have made housing equity withdrawal increasingly unattractive, while very tight credit conditions have made it more difficult to carry out the process as well as to take out new mortgages," said Howard Archer, chief UK economist at IHS Global Insight.
"In addition, ever lower savings rates have made it increasingly more attractive for many people to use any spare funds that they have to reduce their mortgages," he added.
The following is from the Bank of England: Housing Equity Withdrawal (HEW) Q1 2009
HEW occurs when lending secured on housing increases by more than investment in the housing stocks. Investment comprises new houses, home improvements, transfers of houses between sectors, and house moving costs, such as stamp duty and legal fees (although these fees do not add to the value of the housing stock, they are measured as investment, so reduce the funds available for consumption). So HEW measures mortgage lending that is available for consumption or for investment in financial assets (or to pay off debt).
FDIC Bank Failures by Week
by Calculated Risk on 7/03/2009 10:39:00 AM
By popular request ...
The FDIC closed seven more banks yesterday, and the following graph shows bank failures by week for 2009. Click on graph for larger image in new window.
So far there have been 52 FDIC bank failures in 2009.
It appears the pace has picked up lately (12 bank closings over the last two weeks).
Note: Week 1 ends Jan 9th.
This is nothing compared to the S&L crisis. There were 28 weeks during the S&L crisis when regulators closed 10 or more banks, and the peak was April 20, 1998 with 60 bank closures (there were 7 separate weeks with more than 30 closures in the late '80s and early '90s).
The second graph covers the entire FDIC period (since 1934). Back in the '80s, there was some minor multiple counting ... as an example, when First City of Texas failed on Oct 30, 1992 there were 18 different banks closed by the FDIC. This multiple counting was minor, and there were far more bank failures in the late '80s and early '90s than this year.
Of course the number of banks isn't the only measure. Many banks today have more branches, and far more assets and deposits. For a summary by size, see: FDIC Bank Failures: By the Numbers
SEC may Reinstate Uptick Rule for Short Selling
by Calculated Risk on 7/03/2009 09:40:00 AM
From the NY Times: S.E.C. May Reinstate Rules for Short-Selling Stocks
The Securities and Exchange Commission appears poised to reverse itself and reinstate rules that would make shorting stocks ... somewhat more difficult.Some people will always blame the short sellers.
...the most likely outcome may be for the S.E.C. to reinstate ... the uptick rule ...
“I don’t mind what I see as minor inconveniences,” said Whitney Tilson, an author and managing partner of T2 Partners, “if it will get rid of the critics who like to blame short-sellers every time a stock goes down.”
Thursday, July 02, 2009
The Krugman Blues
by Calculated Risk on 7/02/2009 11:41:00 PM
A little night music: Loudon Wainwright III performs 'The Krugman Blues' at Madison Square Park in NYC (June 17, 2009)
Note: The last music video I posted featuring an economist was Merle Hazard's discussion with John Taylor (very funny).
UPDATE: And here is Krugman's column tonight: That ’30s Show
Since the recession began, the U.S. economy has lost 6 ½ million jobs — and as that grim employment report confirmed, it’s continuing to lose jobs at a rapid pace. Once you take into account the 100,000-plus new jobs that we need each month just to keep up with a growing population, we’re about 8 ½ million jobs in the hole.
And the deeper the hole gets, the harder it will be to dig ourselves out. The job figures weren’t the only bad news in Thursday’s report, which also showed wages stalling and possibly on the verge of outright decline. That’s a recipe for a descent into Japanese-style deflation, which is very difficult to reverse. Lost decade, anyone?
Wait — there’s more bad news ...
Another Involuntary Landlord and Summary
by Calculated Risk on 7/02/2009 08:48:00 PM
 | A little sublease space in D.C. Click on photo for larger image in new window. Photo Credit: a reader in dc Taken today, July 2, 2009. |
Here is a repeat of one of the graphs this morning:
 This graph shows the job losses from the start of the employment recession, in percentage terms (as opposed to the number of jobs lost).
The current recession is now the 2nd worst recession since WWII in percentage terms - and also in terms of the unemployment rate (only early '80s recession was worse).
And a few posts:
Employment Report: 467K Jobs Lost, 9.5% Unemployment Rate
Unemployment: Stress Test Scenarios, Diffusion Index, Weekly Claims
Employment-Population Ratio, Part Time Workers, Hours Worked
From Paul Krugman on wages: Smells like deflation
On the '00s (the "Naughts") ...
Employment Dec 1999: 130.53 million
Employment Jun 2009: 131.69 million
A gain of just 1.16 million. What are the odds that the economy loses another 1.16 million jobs over the next 6 months? Pretty high. That would mean no net jobs added to the economy for the naughts: Naught for the Naughts!
Bank Failure #52, 7th Today, Founders Bank, Worth, Illinois
by Calculated Risk on 7/02/2009 06:48:00 PM
Founders gambled deposits
Then rolled a seven.
by Soylent Green is People
From the FDIC: The PrivateBank and Trust Company, Chicago, Illinois, Assumes All of the Deposits of Founders Bank, Worth, Illinois
As of April 30, 2009, Founders Bank had total assets of $962.5 million and total deposits of approximately $848.9 million. ...That makes SEVEN today and SIX in Illinois!
The FDIC estimates that the cost to the Deposit Insurance Fund (DIF) will be $188.5 million. The PrivateBank and Trust Company's acquisition of all the deposits was the "least costly" resolution for the FDIC's DIF compared to alternatives. Founders Bank is the 52nd FDIC-insured institution to fail in the nation this year, and the twelfth in Illinois. The last FDIC-insured institution to be closed in the state was The First National Bank of Danville, earlier today.
Three More Bank Failures: #49, #50, #51
by Calculated Risk on 7/02/2009 06:13:00 PM
Like Whack-A-Mole, banks pop up
Hammered by the man.
by Soylent Green is People
From the FDIC: Millennium State Bank of Texas, Dallas, Texas
From the FDIC: As of June 30, 2009, Millennium State Bank of Texas had total assets of approximately $118 million and total deposits of $115 million. State Bank of Texas agreed to purchase essentially all of the failed banks assets. ... The FDIC estimates that the cost to the Deposit Insurance Fund will be $47 million. State Bank of Texas' acquisition of all the deposits was the "least costly" resolution for the DIF compared to alternatives. Millennium State Bank of Texas is the 51st FDIC-insured institution to fail in the nation this year and the first in Texas. The last bank to fail in the state was Sanderson State Bank, Sanderson, on December 12, 2008.From the FDIC: Elizabeth State Bank, Elizabeth, Illinois
As of April 30, 3009, The Elizabeth State Bank had total assets of $55.5 million and total deposits of approximately $50.4 million. ...The FDIC estimates that the cost to the Deposit Insurance Fund (DIF) will be $11.2 million. Galena State Bank and Trust's acquisition of all the deposits was the "least costly" resolution for the FDIC's DIF compared to alternatives. The Elizabeth State Bank is the 49th FDIC-insured institution to fail in the nation this year, and the tenth in Illinois. The last FDIC-insured institution to be closed in the state was Rock River Bank, Oregon, earlier today.From the FDIC: First National Bank of Danville, Danville, Illinois
As of April 30, 2009, The First National Bank of Danville had total assets of $166 million and total deposits of approximately $147 million. ... The FDIC estimates that the cost to the Deposit Insurance Fund (DIF) will be $24 million. First Financial Bank's, N.A. acquisition of all the deposits was the "least costly" resolution for the FDIC's DIF compared to alternatives. The First National Bank of Danville is the 50th FDIC-insured institution to fail in the nation this year, and the eleventh in Illinois. The last FDIC-insured institution to be closed in the state was The Elizabeth State Bank, Elizabeth, earlier today.Six down today.
Three More Bank Failures: #46, #47, #48
by Calculated Risk on 7/02/2009 05:45:00 PM
This Lincoln State bank fell hard
Now worth a penny.
First State... Second Fail
Winchester, shot by bank Regs
Any more Partner?
A vein has opened
Red ink drains from Rock River
No stop to the flow
by Soylent Green is People
From FDIC: John Warner Bank, Clinton, Illinois
As of April 30, 2009, The John Warner Bank had total assets of $70 million and total deposits of approximately $64 million ... The FDIC estimates that the cost to the Deposit Insurance Fund (DIF) will be $10 million. State Bank of Lincoln's acquisition of all the deposits was the "least costly" resolution for the FDIC's DIF compared to alternatives. The John Warner Bank is the 46th FDIC-insured institution to fail in the nation this year, and the seventh in Illinois.From the FDIC: First State Bank of Winchester, Winchester, Illinois
As of April 30, 2009, The First State Bank of Winchester had total assets of $36 million and total deposits of approximately $34 million. ... The FDIC estimates that the cost to the Deposit Insurance Fund (DIF) will be $6 million. The First National Bank of Beardstown's acquisition of all the deposits was the "least costly" resolution for the FDIC's DIF compared to alternatives. The First State Bank of Winchester is the 47th FDIC-insured institution to fail in the nation this year, and the eighth in IllinoisFrom FDIC: Rock River Bank, Oregon, Illinois
As of April 30, 2009, Rock River Bank had total assets of $77 million and total deposits of approximately $75.8 million ... The FDIC estimates that the cost to the Deposit Insurance Fund (DIF) will be $27.6 million. The Harvard State Bank's acquisition of all the deposits was the "least costly" resolution for the FDIC's DIF compared to alternatives. Rock River Bank is the 48th FDIC-insured institution to fail in the nation this year, and the ninth in Illinois.
Naught for the Naughts?
by Calculated Risk on 7/02/2009 04:00:00 PM
On the '00s (the "Naughts") ...
Employment Dec 1999: 130.53 million
Employment Jun 2009: 131.69 million
A gain of just 1.16 million. What are the odds that the economy loses another 1.16 million jobs over the next 6 months? Pretty high. That would mean no net jobs added to the economy for the naughts: Naught for the Naughts!
And for the stock market?
S&P 500, Dec 31, 1999: 1469.25
S&P 500, July 2, 2009: 897.29
Equity investors wish they went Naught for the Naughts. Click on graph for larger image in new window.
The first graph shows the S&P 500 since 1990.
The dashed line is the closing price today.
The S&P 500 is up almost 33% from the bottom (221 points), and still off almost 43% from the peak (668 points below the max).
This graph is from Doug Short of dshort.com (financial planner): "Four Bad Bears".
Note that the Great Depression crash is based on the DOW; the three others are for the S&P 500.
Personal Bankruptcy Filings increase 40% in June (YoY)
by Calculated Risk on 7/02/2009 02:57:00 PM
From Bloomberg: Consumer Bankruptcy Filings Rose 36.5% in First Half, ABI Says (ht Ron)
U.S. consumers made 675,351 bankruptcy filings in the first half, a 36.5 percent increase from a year ago, according to the American Bankruptcy Institute.The monthly rate slowed in June (from May), but monthly ups and downs are not unusual for this data.
June filings by consumers totaled 116,365, up 40.6 percent from the same period in 2008 ...
 Click on graph for larger image in new window.
This graph shows the non-business bankruptcy filings by quarter.
Note: Quarterly data from Administrative Office of the U.S. Courts, Q1 and Q2 2009 based on monthly data from American Bankruptcy Institute.
The quarterly rate is close to the levels prior to when the Bankruptcy Abuse Prevention and Consumer Protection Act of 2005 (BAPCPA) took effect. There were over 2 million bankruptcies filed in Calendar 2005 ahead of the law change.
The American Bankruptcy Institute is predicting over 1.4 million new bankruptcies by year end - I'll definitely take the over!
FDIC on Private Equity Acquisitions of Failed Banks
by Calculated Risk on 7/02/2009 02:02:00 PM
This is BFT (Bank Failure Thursday), and there are a couple of large banks that might fail (Corus Bank and Guaranty Bank), so this is timely ...
First, from MarketWatch: FDIC chills private-equity bank bidders
The Federal Deposit Insurance Corporation on Thursday urged tough capital requirements on private equity firms buying battered banks, and said any firms they buy must be held for at least three years.From the FDIC: FDIC Board Approves Proposed Policy Statement on Qualifications for Failed Bank Acquisitions
...
"Private-equity investors are probably going to lose their zeal for investing in this undervalued market because the upfront costs will be too much," said Lawrence Kaplan, of counsel in the banking and financial institutions group at law firm Paul Hastings and a former special counsel at the Office of Thrift Supervision.
"The FDIC is saying to private-equity firms that 'while we like your money, we're going to make it too expensive,'" he added.
FDIC Chairman Sheila Bair's Statement
I am particularly concerned with new owners’ ability to support depository institutions with adequate capital, management expertise, and a long term commitment to provide banking services in a safe and sound manner. Obviously, we want to maximize investor interest in failed bank resolutions. On the other hand, we don’t want to see these institutions coming back. I remain open minded on many aspects of this proposal, including the categories of investors to whom it should apply, the appropriate level of upfront capital commitments, and the operation of cross guarantee provisions and limits on affiliate transactions. I look forward to receiving comments in these areas.Federal Register Notice
I support the transactions we have completed to date which have involved sales to private equity owners. We have imposed some special restrictions on these, including higher capital requirements. However, some have suggested that capital requirements should be even higher, given the difficulties in enforcing source of strength obligations outside the initial capital investment made by the acquirers in so-called “shell” structures. I know that this will be a contentious area, and we are opening high, with a proposed 15% requirement.
I am also troubled by the opacity of some of the ownership structures that we have seen in our bidding process, though these have not been winning bids. We have seen bids where it has been difficult to determine actual ownership. We have seen bidders who have wanted permission to immediately flip ownership interests. We have seen structures organized in the secrecy law jurisdictions. So based on the experiences we have gathered, I think it is prudent to put some generic policies in place which tell non-traditional investors that we welcome their participation, but only if we have essential safeguards to assure that they will approach banking in a way that is transparent, long term, and prudently managed.
Hotel RevPAR off 17.4%
by Calculated Risk on 7/02/2009 12:20:00 PM
From HotelNewsNow.com: STR reports U.S. hotel performance for week ending 27 June 2009
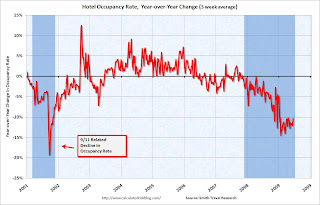
In year-over-year measurements, the industry’s occupancy fell 8.7 percent to end the week at 65.4 percent. Average daily rate dropped 9.5 percent to finish the week at US$97.49. Revenue per available room for the week decreased 17.4 percent to finish at US$63.74.No wonder some expect as many as 20% of U.S. hotels to default on their loans ...
 Click on graph for larger image in new window.
This graph shows the YoY change in the occupancy rate (3 week trailing average).
The three week average is off 10.3% from the same period in 2008.
The average daily rate is down 9.5%, so RevPAR is off 17.4% from the same week last year.
Note: the occupancy rate has risen to 65% - this is just seasonal. The hotel occupancy rate is usually the highest during the peak vacation months of June, July and August (with declines on weeks with holiday weekends).
Employment-Population Ratio, Part Time Workers, Hours Worked
by Calculated Risk on 7/02/2009 10:33:00 AM
A few more graphs based on the (un)employment report ...
Employment-Population Ratio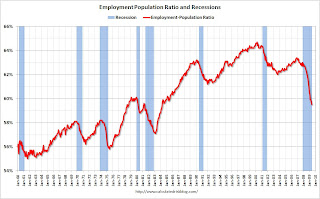 Click on graph for larger image in new window.
This graph show the employment-population ratio; this is the ratio of employed Americans to the adult population.
Note: the graph doesn't start at zero to better show the change.
The general upward trend from the early '60s was mostly due to women entering the workforce. As an example, in 1964 women were about 32% of the workforce, today the percentage is close to 50%.
This measure is at the lowest level since the early '80s and shows the weak recovery following the 2001 recession - and the current cliff diving!
Part Time for Economic Reasons
From the BLS report:
The number of persons working part time for economic reasons (sometimes referred to as involuntary part-time workers) was little changed in June at 9.0 million. Since the start of the recession, the number of such workers has increased by 4.4 million.Note: "This category includes persons who would like to work full time but were working part time because their hours had been cut back or because they were unable to find full-time jobs."
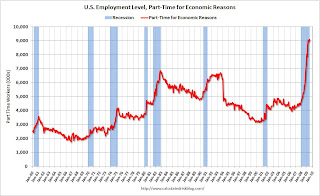 Not only has the unemployment rate risen sharply to 9.5%, but the number of workers only able to find part time jobs (or have had their hours cut for economic reasons) is at 9.0 million.
Of course the U.S. population is significantly larger today (about 305 million) than in the early '80s (about 228 million) when the number of part time workers almost reached 7 million. That is the equivalent of about 9.3 million today, so population adjusted this isn't quite a record - but close.
Average Weekly Hours
From the BLS report:
In June, the average workweek for production and nonsupervisory workers on private nonfarm payrolls fell by 0.1 hour to 33.0 hours--the lowest level on record for the series, which began in 1964.
 The average weekly hours has been declining since the early '60s, but usually falls sharply during a recession. As the BLS noted, average weekly hours in June was at the lowest level since the series began in 1964.
Note: the graph doesn't start at zero to better show the change.
Several analysts follow this series to look for the end of a recession. Usually companies increase the work week before they start hiring, so the average weekly hours increases as a recession ends. Something to watch ...
Earlier employment posts today:
Unemployment: Stress Test Scenarios, Diffusion Index, Weekly Claims
by Calculated Risk on 7/02/2009 09:25:00 AM
Note: earlier Employment post: Employment Report: 467K Jobs Lost, 9.5% Unemployment Rate. The earlier post includes a comparison to previous recessions.
Stress Test Scenarios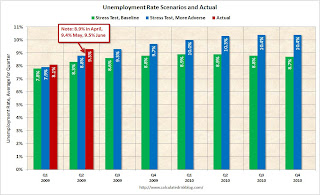 Click on graph for larger image in new window.
This graph shows the unemployment rate compared to the stress test economic scenarios on a quarterly basis as provided by the regulators to the banks (no link).
This is a quarterly forecast: the Unemployment Rate in Q2 was higher than the "more adverse" scenario.
Note also that the unemployment rate has already exceeded the peak of the "baseline scenario".
Diffusion Index
Here is a look at how "widespread" the job losses are using the employment diffusion index from the BLS.
Job losses were widespread across the major industry sectors, with large declines occurring in manufacturing, professional and business services, and construction.
BLS, June Employment Report
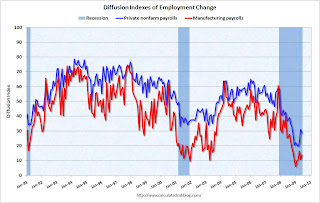 The BLS diffusion index is a measure of how widespread changes in employment are. Some people think it measures the percent of industries increasing employment, but that isn't quite correct.
From the BLS handbook:
The diffusion indexes for private nonfarm payroll employment are based on estimates for 278 industries, while the manufacturing indexes are based on estimates for 84 industries. Each component series is assigned a value of 0, 50, or 100 percent, depending on whether its employment showed a decrease, no change, or an increase over a given period. The average (mean) value is then calculated, and this percent is the diffusion index number.Think of this as a measure of how widespread the job losses are across industries. The further from 50 (above or below), the more widespread the job losses or gains reported by the BLS.
Before September, the all industries employment diffusion index was close to 40, suggesting that job losses were limited to a few industries. However starting in September the diffusion index plummeted. In December, the index hit 20.5, suggesting job losses were very widespread. The index has recovered since then, but declined slightly in June to 28.6, suggesting job losses are still widespread.
The manufacturing diffusion index fell even further, from 40 in May 2008 to just 6 in January 2009. The manufacturing index is still very low in June (13.9) indicating widespread job losses.
Initial Weekly Unemployment Claims
The DOL reports on weekly unemployment insurance claims:
In the week ending June 27, the advance figure for seasonally adjusted initial claims was 614,000, a decrease of 16,000 from the previous week's revised figure of 630,000. The 4-week moving average was 615,250, a decrease of 2,750 from the previous week's revised average of 618,000.
...
The advance number for seasonally adjusted insured unemployment during the week ending June 20 was 6,702,000, a decrease of 53,000 from the preceding week's revised level of 6,755,000.
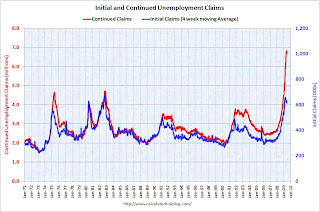 This graph shows weekly claims and continued claims since 1971.
Continued claims decreased to 6.70 million. This is 5.0% of covered employment.
The four-week average of weekly unemployment claims decreased this week, and is now 43,500 below the peak of 12 weeks ago. There is a reasonable chance that claims have peaked for this cycle.
However the level of initial claims (over 614 thousand) is still very high, indicating significant weakness in the job market.
Employment Report: 467K Jobs Lost, 9.5% Unemployment Rate
by Calculated Risk on 7/02/2009 08:30:00 AM
From the BLS:
Nonfarm payroll employment continued to decline in June (-467,000), and the unemployment rate was little changed at 9.5 percent, the Bureau of Labor Statistics of the U.S. Department of Labor reported today. Job losses were widespread across the major industry sectors, with large declines occurring in manufacturing, professional and business services, and construction.
 Click on graph for larger image.
This graph shows the unemployment rate and the year over year change in employment vs. recessions.
Nonfarm payrolls decreased by 467,000 in June. The economy has lost almost 5.7 million jobs over the last year, and 6.46 million jobs during the 18 consecutive months of job losses.
The unemployment rate rose to 9.5 percent; the highest level since 1983.
Year over year employment is strongly negative.
 The second graph shows the job losses from the start of the employment recession, in percentage terms (as opposed to the number of jobs lost).
For the current recession, employment peaked in December 2007, and this recession was a slow starter (in terms of job losses and declines in GDP).
However job losses have really picked up over the last 9 months (4.4 million jobs lost, red line cliff diving on the graph), and the current recession is now the 2nd worst recession since WWII in percentage terms - and also in terms of the unemployment rate (only early '80s recession was worse).
This is another weak employment report ... more soon.
Wednesday, July 01, 2009
A Busy Day
by Calculated Risk on 7/01/2009 09:48:00 PM
A quick summary ...
With California on the verge of issuing IOUs, Gov. Arnold Schwarzenegger moved to conserve cash Wednesday by ordering state workers to take a third day of unpaid furlough each month ... [about 14 percent] pay cut for state workers ...
 Click on graph for larger image in new window.
This graph shows the historical light vehicle sales (seasonally adjusted annual rate) from the BEA (blue) and an estimate for June (red, light vehicle sales of 9.69 million SAAR from AutoData Corp).
 This graph shows private residential and nonresidential construction spending since 1993 through May. Note: nominal dollars, not inflation adjusted.
"Spending on private construction was at a seasonally adjusted annual rate of $649.2 billion, 1.0 percent below the revised April estimate of $655.6 billion."
Residential construction spending fell further in May, and nonresidential spending was up a little (because of private spending on power), but will probably decline sharply over the next two years.
Fed Letter: Should U.S. Bailout States?
by Calculated Risk on 7/01/2009 06:30:00 PM
Here is a review of a few previous state bailouts during recessions by Richard H. Mattoon, senior economist at the Chicago Fed: Should the federal government bail out the states? Lessons from past recessions. A few excerpts:
The rationale for [a bailout] is that states (which are generally prohibited from running deficits) need the money to maintain key programs, such as Medicaid, unemployment insurance, and work force training, for which demand rises during a recession. Also, this aid might help states avoid enacting spending cuts or tax increases that could deepen or prolong the economic downturn.The biggest problem was found to be timing - here is a review of a previous bailout (the 1973-1975 Antirecession Fiscal Assistance (ARFA)):
...
Three factors are particularly important in evaluating the effectiveness of such federal aid to states—timing, triggers, and targeting.
Extensive evaluations were conducted by the U.S. Department of the Treasury, the Congressional Budget Office (CBO), and the U.S. General Accounting Office (GAO) to assess the federal government’s aid package in response to the 1973–75 recession. In general, the reports were critical of the effectiveness of the aid programs. Specifically, the Treasury’s report found that the aid to the states arrived after the recession had already bottomed out and did little to forestall states from taking budgetary actions that likely exacerbated the recession. In addition, a significant portion of the aid was received during the subsequent economic recovery and may have contributed to post-recession inflationary pressures. Finally, it appears that some states failed to spend the money and instead put the aid toward rebuilding state budget balances during the recovery.First, many states are now cutting spending and / or raising taxes - what Krugman calls the Fifty Herbert Hoovers.
emphasis added
Second, aid to the states is already late and the public layoffs are already happening (and tax increases for 25 states). But the "good news" is the recovery will probably be very sluggish - so it is unlikely that the aid will not be used (or lead to inflationary pressures).
Of course states like California need more than a little aid ...
Graphs: Auto Sales in June
by Calculated Risk on 7/01/2009 04:43:00 PM
 Click on graph for larger image in new window.
This graph shows the historical light vehicle sales (seasonally adjusted annual rate) from the BEA (blue) and an estimate for June (red, light vehicle sales of 9.69 million SAAR from AutoData Corp).
June was about average for the year so far on seasonally adjusted basis, and sales are still on pace to be the worst since 1967. The second graph shows light vehicle sales since the BEA started keeping data in 1967.
The small increase in June hardly shows up on the graph.
In 1967 there were 103 million drivers and 9.54 million light vehicles sold; now there are about twice that many (205.7 million licensed drivers in 2007). Compared to the number of drivers, the current sales rate is the lowest since the BEA started tracking auto sales.
California IOU Update
by Calculated Risk on 7/01/2009 04:07:00 PM
From the LA Times: Schwarzenegger orders third furlough day, proposes new cuts
Gov. Arnold Schwarzenegger this morning ordered state workers to take a third day off without pay each month ... If lawmakers and the governor do not agree on a plan to wipe out the deficit -- or at least part of it -- by the end of today, State Controller John Chiang will begin giving out IOUs in lieu of checks to pay debts owed by the state.Here are the FAQs on IOUs (known as Registered Warrants). A few points:
"We have one more day," Senate President Pro Tem Darrell Steinberg (D-Sacramento)
6. Will my financial institution honor a registered warrant?Most banks will probably accept warrants from established customers ...
Recipients of registered warrants should contact their financial institution to determine whether they will honor the registered warrant before the redemption date.
7. What happens if my financial institution will not accept the registered warrant?
You may decide to open an account at another financial institution that will accept registered warrants, or you will have to hold the warrant until it matures on October 1, 2009.
...
9. Who will receive registered warrants?
The State in July will issue registered warrants, or IOUs, for all other payments, including those to private businesses, local governments, taxpayers receiving income tax refunds and owners of unclaimed property.
General Motors June sales fell 33.6% YoY
by Calculated Risk on 7/01/2009 02:01:00 PM
From MarketWatch: General Motors U.S. June sales decline 33.6%
This is worse the the 29% drop in May.
Also: Toyota June U.S. sales down 32% to 131,654 units
And Chrysler June U.S. sales down 42% to 68,297 units
I'll have a summary for the month soon.


