by Calculated Risk on 11/01/2021 09:02:00 PM
Monday, November 01, 2021
Tuesday: CoreLogic House Prices, Housing Vacancies and Homeownership, Vehicle Sales
From Matthew Graham at Mortgage News Daily: Mortgage Rates Catch Up To Last Week's Market Movement (That's a Good Thing)
Mortgage rates moved moderately lower today despite an absence of significant movement in the bond market. In general, when bonds improve, rates fall (and vice versa), but it's not feasible for mortgage lenders to adjust their rates offerings in relative real-time as bonds can send massively mixed signals on any given day. [30 year fixed 3.18%]Tuesday:
emphasis added
• At 8:00 AM ET, Corelogic House Price index for September.
• At 10:00 AM, The Q3 Housing Vacancies and Homeownership report from the Census Bureau.
• All day, Light vehicle sales for October. The consensus is for sales of 12.4 million SAAR, up from 12.2 million SAAR in September (Seasonally Adjusted Annual Rate).
MBA Survey: "Share of Mortgage Loans in Forbearance Decreases to 2.15%"
by Calculated Risk on 11/01/2021 04:00:00 PM
Note: This is as of October 24th.
From the MBA: Share of Mortgage Loans in Forbearance Decreases to 2.15%
The Mortgage Bankers Association’s (MBA) latest Forbearance and Call Volume Survey revealed that the total number of loans now in forbearance decreased by 6 basis points from 2.21% of servicers’ portfolio volume in the prior week to 2.15% as of October 24, 2021. According to MBA’s estimate, 1.1 million homeowners are in forbearance plans.
The share of Fannie Mae and Freddie Mac loans in forbearance decreased 3 basis points to 0.97%. Ginnie Mae loans in forbearance decreased 7 basis points to 2.65%, and the forbearance share for portfolio loans and private-label securities (PLS) declined 8 basis points to 5.13%. The percentage of loans in forbearance for independent mortgage bank (IMB) servicers decreased 6 basis points relative to the prior week to 2.43%, and the percentage of loans in forbearance for depository servicers decreased 4 basis points to 2.07%.
“For the first time since March 2020, the share of Fannie Mae and Freddie Mac loans in forbearance dropped below 1 percent. A small decline for this investor category was matched by similarly small declines for Ginnie Mae and portfolio/PLS loans,” said Mike Fratantoni, MBA’s Senior Vice President and Chief Economist. “Forbearance exits slowed at the end of October to the slowest pace since late August. With so many borrowers having reached the end of their 18-month forbearance term, we expect a steady pace of exits in November.”
emphasis added
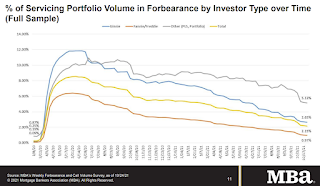 Click on graph for larger image.
This graph shows the percent of portfolio in forbearance by investor type over time. The number of forbearance plans is decreasing rapidly recently since many homeowners have reached the end of the 18-month term.
Some stats on exits:
Of the cumulative forbearance exits for the period from June 1, 2020, through October 24, 2021, at the time of forbearance exit:
• 29.1% resulted in a loan deferral/partial claim.
• 20.6% represented borrowers who continued to make their monthly payments during their forbearance period.
• 16.7% represented borrowers who did not make all of their monthly payments and exited forbearance without a loss mitigation plan in place yet.
• 13.1% resulted in a loan modification or trial loan modification.
• 12.0% resulted in reinstatements, in which past-due amounts are paid back when exiting forbearance.
• 7.1% resulted in loans paid off through either a refinance or by selling the home.
• The remaining 1.4% resulted in repayment plans, short sales, deed-in-lieus or other reasons.
November 1st COVID-19: New Cases per Day Increasing
by Calculated Risk on 11/01/2021 03:52:00 PM
| COVID Metrics | ||||
|---|---|---|---|---|
| Today | Week Ago | Goal | ||
| Percent fully Vaccinated | 58.0% | 57.4% | ≥70.0%1 | |
| Fully Vaccinated (millions) | 192.5 | 190.6 | ≥2321 | |
| New Cases per Day3🚩 | 71,207 | 62,858 | ≤5,0002 | |
| Hospitalized3 | 41,287 | 47,878 | ≤3,0002 | |
| Deaths per Day3 | 1,151 | 1,196 | ≤502 | |
| 1 Minimum to achieve "herd immunity" (estimated between 70% and 85%). 2my goals to stop daily posts, 37 day average for Cases, Currently Hospitalized, and Deaths 🚩 Increasing 7 day average week-over-week for Cases, Hospitalized, and Deaths ✅ Goal met. | ||||
IMPORTANT: For "herd immunity" most experts believe we need 70% to 85% of the total population fully vaccinated (or already had COVID). Note: COVID will probably stay endemic (at least for some time).
The following 22 states have between 50% and 59.9% fully vaccinated: Minnesota at 59.9%, Delaware, Hawaii, Florida, Wisconsin, Nebraska, Iowa, Illinois, Michigan, Kentucky, South Dakota, Texas, Arizona, Kansas, Nevada, Alaska, Utah, North Carolina, Ohio, Montana, Oklahoma, and South Carolina at 50.0%.
Next up (total population, fully vaccinated according to CDC) are Indiana at 49.9%, Missouri at 49.8%, Georgia at 48.2%, and Arkansas at 48.0%.
 Click on graph for larger image.
This graph shows the daily (columns) and 7 day average (line) of positive tests reported.
The Rapid Increase in Rents Continues
by Calculated Risk on 11/01/2021 02:31:00 PM
Today, in the Real Estate Newsletter: The Rapid Increase in Rents Continues New Leases up Sharply year-over-year in September
Excerpt:
The Zillow measure is up 9.2% YoY in September, up from 8.4% YoY in August. And the ApartmentList measure is up 15.1% as of September, up from 12.5% in August. Both the Zillow measure (a repeat rent index), and ApartmentList are showing a sharp increase in rents.
...
Clearly rents are increasing sharply, and we should expect this to spill over into measures of inflation in 2022. The Owners Equivalent Rent (OER) was up 2.9% YoY in September, from 2.6% in August - and will increase further in the coming months.
Housing Inventory Nov 1st Update: Inventory Down 2.2% Week-over-week
by Calculated Risk on 11/01/2021 11:17:00 AM
Tracking existing home inventory will be very important this year.

This inventory graph is courtesy of Altos Research.
Construction Spending Decreased in September
by Calculated Risk on 11/01/2021 10:21:00 AM
From the Census Bureau reported that overall construction spending was "virtually unchanged":
Construction spending during September 2021 was estimated at a seasonally adjusted annual rate of $1,573.6 billion, 0.5 percent below the revised August estimate of $1,582.0 billion. The September figure is 7.8 percent above the September 2020 estimate of $1,459.3 billion.Both private and public spending decreased:
emphasis added
Spending on private construction was at a seasonally adjusted annual rate of $1,229.9 billion, 0.5 percent below the revised August estimate of $1,236.1 billion. ...
In September, the estimated seasonally adjusted annual rate of public construction spending was $343.7 billion, 0.7 percent below the revised August estimate of $345.9 billion.
 Click on graph for larger image.
This graph shows private residential and nonresidential construction spending, and public spending, since 1993. Note: nominal dollars, not inflation adjusted.
Residential spending is 14% above the bubble peak (in nominal terms - not adjusted for inflation).
Non-residential spending is 10% above the bubble era peak in January 2008 (nominal dollars), but has been weak recently.
Public construction spending is 6% above the peak in March 2009, but weak recently.
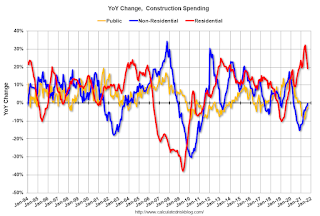 The second graph shows the year-over-year change in construction spending.
On a year-over-year basis, private residential construction spending is up 19.3%. Non-residential spending is down 0.5% year-over-year. Public spending is down 2.4% year-over-year.
Construction was considered an essential service during the early months of the pandemic in most areas, and did not decline sharply like many other sectors. However, some sectors of non-residential have been under pressure. For example, lodging is down 32.8% YoY, and office down 2.9% YoY.
ISM® Manufacturing index decreased to 60.8% in October
by Calculated Risk on 11/01/2021 10:07:00 AM
(Posted with permission). The ISM manufacturing index indicated expansion in September. The PMI® was at 60.8% in October, down from 61.1% in September. The employment index was at 52.0%, up from 50.2% last month, and the new orders index was at 59.8%, down from 66.7%.
From ISM: Manufacturing PMI® at 61.1% October 2021 Manufacturing ISM® Report On Business®
Economic activity in the manufacturing sector grew in October, with the overall economy achieving a 17th consecutive month of growth, say the nation's supply executives in the latest Manufacturing ISM® Report On Business®.This was at expectations, and this suggests manufacturing expanded at a slightly slower pace in October than in September.
The report was issued today by Timothy R. Fiore, CPSM, C.P.M., Chair of the Institute for Supply Management® (ISM®) Manufacturing Business Survey Committee:
“The October Manufacturing PMI® registered 60.8 percent, a decrease of 0.3 percentage point from the September reading of 61.1 percent. This figure indicates expansion in the overall economy for the 17th month in a row after a contraction in April 2020. The New Orders Index registered 59.8 percent, down 6.9 percentage points compared to the September reading of 66.7 percent. The Production Index registered 59.3 percent, a decrease of 0.1 percentage point compared to the September reading of 59.4 percent. The Prices Index registered 85.7 percent, up 4.5 percentage points compared to the September figure of 81.2 percent. The Backlog of Orders Index registered 63.6 percent, 1.2 percentage points lower than the September reading of 64.8 percent. The Employment Index registered 52 percent, 1.8 percentage points higher compared to the September reading of 50.2 percent. The Supplier Deliveries Index registered 75.6 percent, up 2.2 percentage points from the September figure of 73.4 percent. The Inventories Index registered 57 percent, 1.4 percentage points higher than the September reading of 55.6 percent. The New Export Orders Index registered 54.6 percent, an increase of 1.2 percentage points compared to the September reading of 53.4 percent. The Imports Index registered 49.1 percent, a 5.8-percentage point decrease from the September reading of 54.9 percent.”
emphasis added
Seven High Frequency Indicators for the Economy
by Calculated Risk on 11/01/2021 08:17:00 AM
These indicators are mostly for travel and entertainment. It will interesting to watch these sectors recover as the pandemic subsides.
The TSA is providing daily travel numbers.
This data is as of October 31st.
 Click on graph for larger image.
This data shows the 7-day average of daily total traveler throughput from the TSA for 2019 (Light Blue), 2020 (Blue) and 2021 (Red).
The dashed line is the percent of 2019 for the seven day average.
The 7-day average is down 17.8% from the same day in 2019 (82.2% of 2019). (Dashed line)
The second graph shows the 7-day average of the year-over-year change in diners as tabulated by OpenTable for the US and several selected cities.
 Thanks to OpenTable for providing this restaurant data:
This data is updated through October 30, 2021.
This data is "a sample of restaurants on the OpenTable network across all channels: online reservations, phone reservations, and walk-ins. For year-over-year comparisons by day, we compare to the same day of the week from the same week in the previous year."
Note that this data is for "only the restaurants that have chosen to reopen in a given market". Since some restaurants have not reopened, the actual year-over-year decline is worse than shown.
Dining picked up for the Labor Day weekend, but declined after the holiday - but might be picking up a little again. The 7-day average for the US is down 4% compared to 2019.
 This data shows domestic box office for each week and the median for the years 2016 through 2019 (dashed light blue).
 Note that the data is usually noisy week-to-week and depends on when blockbusters are released.
Movie ticket sales were at $112 million last week, down about 25% from the median for the week.
 This graph shows the seasonal pattern for the hotel occupancy rate using the four week average.
 The red line is for 2021, black is 2020, blue is the median, dashed purple is 2019, and dashed light blue is for 2009 (the worst year on record for hotels prior to 2020).
This data is through October 23rd. The occupancy rate was down 9.1% compared to the same week in 2019.
Notes: Y-axis doesn't start at zero to better show the seasonal change.
 This graph, based on weekly data from the U.S. Energy Information Administration (EIA), shows gasoline supplied compared to the same week of 2019.
Blue is for 2020. Red is for 2021.
As of October 22nd, gasoline supplied was down 4.7% compared to the same week in 2019.
There have been seven weeks so far this year when gasoline supplied was up compared to the same week in 2019 - and consumption is running close to 2019 levels now.
This graph is from Apple mobility. From Apple: "This data is generated by counting the number of requests made to Apple Maps for directions in select countries/regions, sub-regions, and cities." This is just a general guide - people that regularly commute probably don't ask for directions.
There is also some great data on mobility from the Dallas Fed Mobility and Engagement Index. However the index is set "relative to its weekday-specific average over January–February", and is not seasonally adjusted, so we can't tell if an increase in mobility is due to recovery or just the normal increase in the Spring and Summer.
 This data is through October 28th
 The graph is the running 7-day average to remove the impact of weekends.
IMPORTANT: All data is relative to January 13, 2020. This data is NOT Seasonally Adjusted. People walk and drive more when the weather is nice, so I'm just using the transit data.
According to the Apple data directions requests, public transit in the 7 day average for the US is at 114% of the January 2020 level.
Here is some interesting data on New York subway usage (HT BR).
 This graph is from Todd W Schneider.
 This data is through Friday, October 29th.
He notes: "Data updates weekly from the MTA’s public turnstile data, usually on Saturday mornings".
Sunday, October 31, 2021
Monday: ISM Mfg, Construction Spending
by Calculated Risk on 10/31/2021 07:25:00 PM
Weekend:
• Schedule for Week of October 31, 2021
• FOMC Preview: Taper Announcement Expected
• 2022 Housing Forecasts: First Look Optimism on New Home Sales in 2022
Monday:
• At 10:00 AM ET, ISM Manufacturing Index for October. The consensus is for 60.5%, down from 61.1%.
• At 10:00 AM, Construction Spending for September. The consensus is for 0.4% increase in spending.
From CNBC: Pre-Market Data and Bloomberg futures S&P 500 are up 6 and DOW futures are up 59 (fair value).
Oil prices were down over the last week with WTI futures at $82.84 per barrel and Brent at $83.05 per barrel. A year ago, WTI was at $36, and Brent was at $36 - so WTI oil prices are up more than double year-over-year.
Here is a graph from Gasbuddy.com for nationwide gasoline prices. Nationally prices are at $3.38 per gallon. A year ago prices were at $2.10 per gallon, so gasoline prices are up $1.28 per gallon year-over-year.
2022 Housing Forecasts: First Look
by Calculated Risk on 10/31/2021 05:05:00 PM
Today, in the Newsletter: 2022 Housing Forecasts: First Look
Excerpt (there is much more):
The key in 2022 will be inventory. If inventory stays extremely low, there will be more housing starts and a larger increase in prices. However, if inventory increases significantly, there will be fewer starts and less price appreciation.
Towards the end of each year I collect some housing forecasts for the following year.
FOMC Preview: Taper Announcement Expected
by Calculated Risk on 10/31/2021 08:11:00 AM
Expectations are the FOMC will announce the tapering of assets purchases at the meeting this week.
From Goldman Sachs:
"The FOMC will announce the start of tapering next week, presumably at the $15bn per month pace noted in the September minutes. If implementation begins in mid-November, the last taper would come in June 2022. Large surprises on the virus, inflation, wage growth, or inflation expectations could prompt a revision, but we think the hurdle for a change in either direction is high."Analysts will also be looking for comments on inflation and possible rate hikes in 2022. Goldman Sachs now expects two rates hikes next year:
"We are pulling forward our forecast for the Fed’s first rate hike by one full year to July 2022, shortly after tapering is scheduled to conclude. We expect a second hike in November 2022 and two hikes per year after that."
Early Wall Street forecasts are for GDP to increase at a 5% to 6% annual rate in Q4 that would put Q4-over-Q4 at around 5.0% to 5.2% - so the FOMC projections for 2021 are now a little on the high side compared to Wall Street.
| GDP projections of Federal Reserve Governors and Reserve Bank presidents, Change in Real GDP1 | ||||
|---|---|---|---|---|
| Projection Date | 2021 | 2022 | 2023 | 2024 |
| Sept 2021 | 5.8 to 6.0 | 3.4 to 4.5 | 2.2 to 2.5 | 2.0 to 2.2 |
| June 2021 | 6.8 to 7.3 | 2.8 to 3.8 | 2.0 to 2.5 | |
| Unemployment projections of Federal Reserve Governors and Reserve Bank presidents, Unemployment Rate2 | ||||
|---|---|---|---|---|
| Projection Date | 2021 | 2022 | 2023 | 2024 |
| Sept 2021 | 4.6 to 4.8 | 3.6 to 4.0 | 3.3 to 3.7 | 3.3 to 3.6 |
| June 2021 | 4.4 to 4.8 | 3.5 to 4.0 | 3.2 to 3.8 | |
The decline in the unemployment rate depends on both job growth, and the participation rate. A strong labor market will probably encourage people to return to the labor force, and the improvements in the unemployment rate might be slower than some expect.
As of September 2021, PCE inflation was up 4.4% from September 2020. This is just above the top end of the projected range for Q4.
| Inflation projections of Federal Reserve Governors and Reserve Bank presidents, PCE Inflation1 | ||||
|---|---|---|---|---|
| Projection Date | 2021 | 2022 | 2023 | 2024 |
| Sept 2021 | 4.0 to 4.3 | 2.0 to 2.5 | 2.0 to 2.3 | 2.0 to 2.2 |
| June 2021 | 3.1 to 3.5 | 1.9 to 2.3 | 2.0 to 2.2 | |
PCE core inflation was up 3.6% in September year-over-year.
| Core Inflation projections of Federal Reserve Governors and Reserve Bank presidents, Core Inflation1 | ||||
|---|---|---|---|---|
| Projection Date | 2021 | 2022 | 2023 | 2024 |
| Sept 2021 | 3.6 to 3.8 | 2.0 to 2.5 | 2.0 to 2.3 | 2.0 to 2.2 |
| June 2021 | 2.9 to 3.1 | 1.9 to 2.3 | 2.0 to 2.2 | |
Saturday, October 30, 2021
Real Estate Newsletter Articles this Week
by Calculated Risk on 10/30/2021 02:11:00 PM
At the Calculated Risk Real Estate Newsletter this week:
• Final Look: Local Housing Markets in September
• New Home Sales: Record 106 thousand homes have not been started
• Case-Shiller National Index up Record 19.8% Year-over-year in August The Deceleration is coming
• Real House Prices, Price-to-Rent Ratio and Price-to-Median Income in August And a look at "Affordability"
• Mortgage Rates Slowly Increasing The Fed is Expected to "Taper" Asset Purchases Starting Next Week
This will usually be published several times a week, and will provide more in-depth analysis of the housing market.
You can subscribe at https://calculatedrisk.substack.com/ Currently all content is available for free - and some will always be free - but please subscribe!.
Schedule for Week of October 31, 2021
by Calculated Risk on 10/30/2021 08:11:00 AM
Boo!
The key report this week is the October employment report on Friday.
Other key indicators include the October ISM manufacturing and services indexes, October vehicle sales, and the September trade deficit.
The FOMC meets on Tuesday and Wednesday this week, and they are expected to announce tapering of asset purchases.
10:00 AM: ISM Manufacturing Index for October. The consensus is for 60.5%, down from 61.1%.
10:00 AM: Construction Spending for September. The consensus is for 0.4% increase in spending.
8:00 AM ET: Corelogic House Price index for September.
10:00 AM: The Q3 Housing Vacancies and Homeownership report from the Census Bureau.
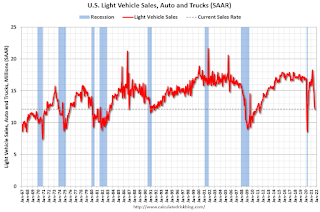 All day: Light vehicle sales for October.
The consensus is for sales of 12.4 million SAAR, up from 12.2 million SAAR in September (Seasonally Adjusted Annual Rate).
This graph shows light vehicle sales since the BEA started keeping data in 1967. The dashed line is the current sales rate.
7:00 AM ET: The Mortgage Bankers Association (MBA) will release the results for the mortgage purchase applications index.
8:15 AM: The ADP Employment Report for October. This report is for private payrolls only (no government). The consensus is for 400,000 jobs added, down from 568,000 in September.
10:00 AM: the ISM Services Index for October. The consensus is for a decrease to 59.5 from 61.9.
2:00 PM: FOMC Meeting Announcement. The FOMC is expected to announce tapering of asset purchases at this meeting.
2:30 PM: Fed Chair Jerome Powell holds a press briefing following the FOMC announcement.
8:30 AM: The initial weekly unemployment claims report will be released. The consensus is for 275 thousand initial claims, down from 281 thousand last week.
 8:30 AM: Trade Balance report for September from the Census Bureau. The consensus is for the deficit to be $74.1 billion in September, from $73.3 billion in August.
This graph shows the U.S. trade deficit, with and without petroleum, through the most recent report. The blue line is the total deficit, and the black line is the petroleum deficit, and the red line is the trade deficit ex-petroleum products.
 8:30 AM: Employment Report for October. The consensus is for 450 thousand jobs added, and for the unemployment rate to decrease to 4.7%.
There were 194 thousand jobs added in September, and the unemployment rate was at 4.8%.
This graph shows the job losses from the start of the employment recession, in percentage terms.
The current employment recession was by far the worst recession since WWII in percentage terms, but currently is not as severe as the worst of the "Great Recession".
Friday, October 29, 2021
Fannie Mae: Mortgage Serious Delinquency Rate Decreased in September
by Calculated Risk on 10/29/2021 04:10:00 PM
Fannie Mae reported that the Single-Family Serious Delinquency decreased to 1.62% in September, from 1.79% in August. The serious delinquency rate is down from 3.20% in September 2020.
These are mortgage loans that are "three monthly payments or more past due or in foreclosure".
The Fannie Mae serious delinquency rate peaked in February 2010 at 5.59% following the housing bubble, and peaked at 3.32% in August 2020 during the pandemic.
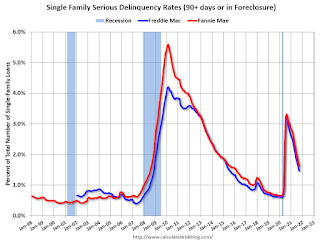
By vintage, for loans made in 2004 or earlier (1% of portfolio), 4.25% are seriously delinquent (down from 4.47% in August). For loans made in 2005 through 2008 (2% of portfolio), 7.21% are seriously delinquent (down from 7.57%), For recent loans, originated in 2009 through 2021 (97% of portfolio), 1.31% are seriously delinquent (down from 1.46%). So Fannie is still working through a few poor performing loans from the bubble years.
Mortgages in forbearance are counted as delinquent in this monthly report, but they will not be reported to the credit bureaus.
This is very different from the increase in delinquencies following the housing bubble. Lending standards have been fairly solid over the last decade, and most of these homeowners have equity in their homes - and they will be able to restructure their loans once they are employed.
Freddie Mac reported earlier.
October 29th COVID-19: Still Close to 70,000 Cases per Day
by Calculated Risk on 10/29/2021 03:34:00 PM
| COVID Metrics | ||||
|---|---|---|---|---|
| Today | Week Ago | Goal | ||
| Percent fully Vaccinated | 57.8% | 57.3% | ≥70.0%1 | |
| Fully Vaccinated (millions) | 192.0 | 190.2 | ≥2321 | |
| New Cases per Day3 | 68,177 | 73,020 | ≤5,0002 | |
| Hospitalized3 | 44,829 | 50,335 | ≤3,0002 | |
| Deaths per Day3 | 1,086 | 1,232 | ≤502 | |
| 1 Minimum to achieve "herd immunity" (estimated between 70% and 85%). 2my goals to stop daily posts, 37 day average for Cases, Currently Hospitalized, and Deaths 🚩 Increasing 7 day average week-over-week for Cases, Hospitalized, and Deaths ✅ Goal met. | ||||
IMPORTANT: For "herd immunity" most experts believe we need 70% to 85% of the total population fully vaccinated (or already had COVID). Note: COVID will probably stay endemic (at least for some time).
The following 20 states have between 50% and 59.9% fully vaccinated: Minnesota at 59.8%, Delaware, Hawaii, Florida, Wisconsin, Nebraska, Iowa, Illinois, Michigan, Kentucky, South Dakota, Texas, Arizona, Kansas, Nevada, Alaska, Utah, North Carolina, Ohio and Montana at 50.4%.
Next up (total population, fully vaccinated according to CDC) are Oklahoma at 49.9%, South Carolina at 49.9%, Indiana at 49.8%, Missouri at 49.7%, Georgia at 48.0%, and Arkansas at 47.9%.
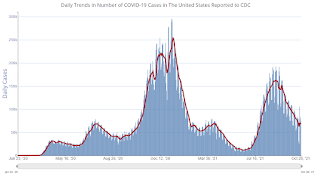 Click on graph for larger image.
This graph shows the daily (columns) and 7 day average (line) of positive tests reported.
Early Q4 GDP Forecasts: Around 5% to 6%
by Calculated Risk on 10/29/2021 02:51:00 PM
We are taking the glass-half-full approach and holding to our forecast for 6% real GDP growth in 4Q with a gradual slowing through the course of 2022. However, we acknowledge the risks to the downside particularly from higher inflation and weaker consumer sentiment, chiefly the expectations measures. [October 29 estimate]From Goldman Sachs
emphasis added
We launched our Q4 GDP tracking estimate at +4.5% (qoq ar). [October 29 estimate]And from the Altanta Fed: GDPNow
The initial GDPNow model estimate for real GDP growth (seasonally adjusted annual rate) in the fourth quarter of 2021 is 6.6 percent on October 29. [October 29 estimate]
Real Personal Income: Transfer Payments
by Calculated Risk on 10/29/2021 12:16:00 PM
The BEA released the Personal Income and Outlays, September 2021 report this morning. The report showed that government transfer payments were still almost $695 billion (on SAAR basis) above the February 2020 level (pre-pandemic) Note: Seasonal adjustment doesn't make sense with one time payments, but that is how the data is presented.
| Selected Transfer Payments Billions of dollars, SAAR | ||
|---|---|---|
| Other | Unemployment Insurance | |
| Jan-20 | $511 | $26 |
| Feb-20 | $506 | $26 |
| Mar-20 | $516 | $67 |
| Apr-20 | $3,393 | $435 |
| May-20 | $1,373 | $1,287 |
| Jun-20 | $743 | $1,396 |
| Jul-20 | $750 | $1,366 |
| Aug-20 | $697 | $612 |
| Sep-20 | $950 | $325 |
| Oct-20 | $714 | $296 |
| Nov-20 | $580 | $285 |
| Dec-20 | $604 | $319 |
| Jan-21 | $2,317 | $574 |
| Feb-21 | $735 | $558 |
| Mar-21 | $4,706 | $566 |
| Apr-21 | $1,345 | $516 |
| May-21 | $806 | $492 |
| Jun-21 | $744 | $433 |
| Jul-21 | $921 | $368 |
| Aug-21 | $944 | $352 |
| Sep-21 | $894 | $98 |
Black Knight: Number of Mortgages in Forbearance Declines Slightly
by Calculated Risk on 10/29/2021 10:14:00 AM
Note: Both Black Knight and the MBA (Mortgage Bankers Association) are putting out weekly estimates of mortgages in forbearance.
This data is as of October 26th.
From Andy Walden at Black Knight: Forbearance Plan Exits Steady Ahead of Month-End Deadlines
The number of mortgage holders exiting forbearance held steady this week and is expected to accelerate over the next few days with month-end deadlines looming.
According to our McDash Flash daily forbearance tracking dataset, the number of active forbearance plans fell 19,000 (-1.5%), with declines of 7,900 among GSE loans, 7,700 among FHA/VA mortgages and 3,300 among portfolio-held and privately securitized (PLS) mortgages. That’s modestly better than last week’s 7,300 (-0.6%) decrease.
As of October 26, 1.22 million mortgage holders remain in COVID-19 related forbearance plans. That’s 2.3% of all active mortgages, including 1.3% of GSE, 3.8% of FHA/VA and 3% of portfolio held and privately securitized loans.
Click on graph for larger image.
More than 470,000 homeowners left forbearance in the first 26 days of October, making it the largest month for exit activity in more than a year. And with more than 225,000 plans still up for review before the end of the month, including 140,000 facing final expiration, that number is likely to increase significantly in coming weeks.
Forbearance plan starts edged slightly higher this week but are still down 28% from the same time last month.
emphasis added
Personal Income Decreased 1.0% in September, Spending Increased 0.6%
by Calculated Risk on 10/29/2021 08:35:00 AM
The BEA released the Personal Income and Outlays report for September:
Personal income decreased $216.2 billion (1.0 percent) in September according to estimates released today by the Bureau of Economic Analysis. Disposable personal income (DPI) decreased $236.9 billion (1.3 percent) and personal consumption expenditures (PCE) increased $93.4 billion (0.6 percent).The September PCE price index increased 4.4 percent year-over-year and the September PCE price index, excluding food and energy, increased 3.6 percent year-over-year.
Real DPI decreased 1.6 percent in September and Real PCE increased 0.3 percent; goods increased 0.1 percent and services increased 0.4 percent. The PCE price index increased 0.3 percent. Excluding food and energy, the PCE price index increased 0.2 percent.
emphasis added
The following graph shows real Personal Consumption Expenditures (PCE) through September 2021 (2012 dollars). Note that the y-axis doesn't start at zero to better show the change.
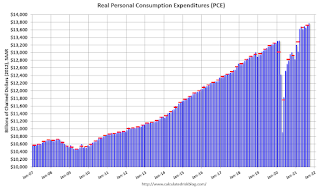 Click on graph for larger image.
The dashed red lines are the quarterly levels for real PCE.
Personal income was below expectations, and the increase in PCE was at expectations.
Thursday, October 28, 2021
Friday: Personal Income and Outlays, Chicago PMI
by Calculated Risk on 10/28/2021 09:00:00 PM
Thursday:
• At 8:30 AM ET, Personal Income and Outlays for September. The consensus is for a 0.1% decrease in personal income, and for a 0.5% increase in personal spending. And for the Core PCE price index to increase 0.2%.
• At 9:45 AM, Chicago Purchasing Managers Index for October. The consensus is for a reading of 64.0, down from 64.7 in September.
• At 10:00 AM, University of Michigan's Consumer sentiment index (Final for October). The consensus is for a reading of 71.6.


