by Calculated Risk on 11/04/2021 03:30:00 PM
Thursday, November 04, 2021
November 4th COVID-19: Over 70,000 New Cases per Day
| COVID Metrics | ||||
|---|---|---|---|---|
| Today | Week Ago | Goal | ||
| Percent fully Vaccinated | 58.1% | 57.6% | ≥70.0%1 | |
| Fully Vaccinated (millions) | 192.9 | 191.2 | ≥2321 | |
| New Cases per Day3 | 70,431 | 71,450 | ≤5,0002 | |
| Hospitalized3 | 41,850 | 45,892 | ≤3,0002 | |
| Deaths per Day3 | 1,109 | 1,216 | ≤502 | |
| 1 Minimum to achieve "herd immunity" (estimated between 70% and 85%). 2my goals to stop daily posts, 37 day average for Cases, Currently Hospitalized, and Deaths 🚩 Increasing 7 day average week-over-week for Cases, Hospitalized, and Deaths ✅ Goal met. | ||||
IMPORTANT: For "herd immunity" most experts believe we need 70% to 85% of the total population fully vaccinated (or already had COVID). Note: COVID will probably stay endemic (at least for some time).
The following 20 states have between 50% and 59.9% fully vaccinated: Hawaii at 59.9%, Florida, Wisconsin, Nebraska, Iowa, Illinois, Michigan, Kentucky, South Dakota, Texas, Arizona, Kansas, Nevada, Alaska, Utah, North Carolina, Ohio, Montana, Oklahoma, and South Carolina at 50.1%.
Next up (total population, fully vaccinated according to CDC) are Indiana at 49.9%, Missouri at 49.9%, Georgia at 48.4%, and Arkansas at 48.1%.
 Click on graph for larger image.
This graph shows the daily (columns) and 7 day average (line) of positive tests reported.
October Employment Preview
by Calculated Risk on 11/04/2021 01:37:00 PM
On Friday at 8:30 AM ET, the BLS will release the employment report for October. The consensus is for 450 thousand jobs added, and for the unemployment rate to decrease to 4.7%.
 Click on graph for larger image.
• First, currently there are still about 5.0 million fewer jobs than in February 2020 (before the pandemic).
This graph shows the job losses from the start of the employment recession, in percentage terms.
The current employment recession was by far the worst recession since WWII in percentage terms, but is now better than the worst of the "Great Recession".
• ADP Report: The ADP employment report showed a gain of 571,000 private sector jobs, above the consensus estimate of 400,000 jobs added. The ADP report hasn't been very useful in predicting the BLS report, but this suggests the BLS report could be above expectations.
• ISM Surveys: Note that the ISM services are diffusion indexes based on the number of firms hiring (not the number of hires). The ISM® manufacturing employment index increased in October to 52.0%, up from 50.2% last month. This would suggest a decline in manufacturing employment of around 8,000 jobs in October. ADP showed 53,000 manufacturing jobs added.
The ISM® Services employment index decreased in October to 51.6%, down from 53.0% last month. This would suggest an increase in service employment of around 115,000 jobs in September.
Combined, the ISM indexes suggest a weaker than expected employment report.
• Unemployment Claims: The weekly claims report showed a sharp decline in the number of initial unemployment claims during the reference week (includes the 12th of the month) from 351,000 in September to 291,000 in October. This would usually suggest fewer layoffs in October than in September, although this might not be very useful right now. In general, weekly claims have been falling, and have been below expectations in October.
 • Permanent Job Losers: Something to watch in the employment report will be "Permanent job losers". This graph shows permanent job losers as a percent of the pre-recession peak in employment through the June report.
This data is only available back to 1994, so there is only data for three recessions. In September, the number of permanent job losers decreased to 2.251 million from 2.487 million in August. These jobs will likely be the hardest to recover, so it is a positive that the number of permanent job losers is declining rapidly
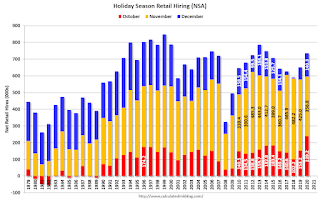 • Seasonal Retail Hiring: Typically retail companies start hiring for the holiday season in October, and really increase hiring in November. But only a few temporary workers are hired in December. Here is a graph that shows the historical net retail jobs added for October, November and December by year.
In 2020, retailers hired 239,200 employees (NSA) in October (most seasonal, but some bounce back during pandemic). That translated to a gain of 106,000 jobs SA.
• Conclusion: There is significant optimism concerning the October employment report, and many analysts are expecting a strong report. We have to be a little cautious because some of the apparent pickup in hiring might be for seasonal retail jobs.
Hotels: Occupancy Rate Down 6% Compared to Same Week in 2019
by Calculated Risk on 11/04/2021 11:20:00 AM
Note: Since occupancy declined sharply at the onset of the pandemic, CoStar is comparing to 2019.
As anticipated ahead of Halloween, U.S. hotel performance fell week over week, according to STR‘s latest data through 30 October.The following graph shows the seasonal pattern for the hotel occupancy rate using the four week average.
Oct. 24-30, 2021 (percentage change from comparable week in 2019*):
• Occupancy: 58.9% (-5.7%)
• Average daily rate (ADR): US$127.70 (+1.5%)
• evenue per available room (RevPAR): US$75.28 (-4.3%)
Even with a drop in performance levels from previous weeks, comparisons with the matching week in 2019 improved because Halloween that year fell on a Thursday and created a more significant disruption in business travel and groups.
*Due to the steep, pandemic-driven performance declines of 2020, STR is measuring recovery against comparable time periods from 2019.
emphasis added
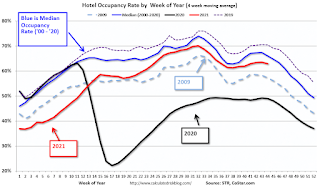 Click on graph for larger image.
The red line is for 2021, black is 2020, blue is the median, dashed purple is 2019, and dashed light blue is for 2009 (the worst year on record for hotels prior to 2020).
Trade Deficit Increased to $80.9 Billion in September
by Calculated Risk on 11/04/2021 08:48:00 AM
From the Department of Commerce reported:
The U.S. Census Bureau and the U.S. Bureau of Economic Analysis announced today that the goods and services deficit was $80.9 billion in September, up $8.1 billion from $72.8 billion in August, revised.
September exports were $207.6 billion, $6.4 billion less than August exports. September imports were $288.5 billion, $1.7 billion more than August imports.
emphasis added
 Click on graph for larger image.
Exports decreased and imports increased in September.
Exports are up 17% compared to September 2020; imports are up 20% compared to September 2020.
Both imports and exports decreased sharply due to COVID-19, and have now bounced back (imports more than exports),
The second graph shows the U.S. trade deficit, with and without petroleum.
 The blue line is the total deficit, and the black line is the petroleum deficit, and the red line is the trade deficit ex-petroleum products.
Note that net, imports and exports of petroleum products are close to zero.
The trade deficit with China increased to $36.5 billion in September, from $29.7 billion in September 2020.
Weekly Initial Unemployment Claims Decrease to 269,000
by Calculated Risk on 11/04/2021 08:33:00 AM
The DOL reported:
In the week ending October 30, the advance figure for seasonally adjusted initial claims was 269,000, a decrease of 14,000 from the previous week's revised level. This is the lowest level for initial claims since March 14, 2020 when it was 256,000. The previous week's level was revised up by 2,000 from 281,000 to 283,000. The 4-week moving average was 284,750, a decrease of 15,000 from the previous week's revised average. This is the lowest level for this average since March 14, 2020 when it was 225,500. The previous week's average was revised up by 500 from 299,250 to 299,750.The following graph shows the 4-week moving average of weekly claims since 1971.
emphasis added
 Click on graph for larger image.
The dashed line on the graph is the current 4-week average. The four-week average of weekly unemployment claims decreased to 284,750.
The previous week was revised up.
Regular state continued claims decreased to 2,105,000 (SA) from 2,239,000 (SA) the previous week.
Weekly claims were below consensus forecast.
Wednesday, November 03, 2021
Thursday: Unemployment Claims, Trade Deficit
by Calculated Risk on 11/03/2021 09:00:00 PM
Thursday:
• At 8:30 AM ET, The initial weekly unemployment claims report will be released. The consensus is for 275 thousand initial claims, down from 281 thousand last week.
• Also a 8:30 AM, Trade Balance report for September from the Census Bureau. The consensus is for the deficit to be $74.1 billion in September, from $73.3 billion in August.
Vehicle Sales, Sales Mix and Heavy Trucks
by Calculated Risk on 11/03/2021 05:34:00 PM
The BEA released their estimate of light vehicle sales for October today. The BEA estimates sales of 12.99 million SAAR in October 2021 (Seasonally Adjusted Annual Rate), up 6.3% from the September sales rate, and down 20.8% from October 2020.
 Click on graph for larger image.
This graph shows light vehicle sales since 1967 from the BEA. The dashed line is sales for the current month.
The impact of COVID-19 was significant, and April 2020 was the worst month.
After April 2020, sales increased, and were close to sales in 2019 (the year before the pandemic).
This second graph shows the percent of light vehicle sales between passenger cars and trucks / SUVs through October 2021.
 Over time the mix has changed more and more towards light trucks and SUVs.
Only when oil prices are high, does the trend slow or reverse.
The percent of light trucks and SUVs was at 80.1% in October 2021 - an all time high.
The third graph shows heavy truck sales since 1967 using data from the BEA. The dashed line is the October 2021 seasonally adjusted annual sales rate (SAAR).
Heavy truck sales really collapsed during the great recession, falling to a low of 180 thousand SAAR in May 2009. Then heavy truck sales increased to a new all time high of 563 thousand SAAR in September 2019.
Note: "Heavy trucks - trucks more than 14,000 pounds gross vehicle weight."
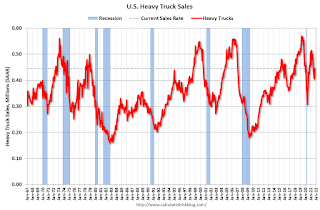 Heavy truck sales really declined at the beginning of the pandemic, falling to a low of 299 thousand SAAR in May 2020.
 November 3rd COVID-19: Over 70,000 New Cases per Day
by Calculated Risk on 11/03/2021 05:32:00 PM
| COVID Metrics | ||||
|---|---|---|---|---|
| Today | Week Ago | Goal | ||
| Percent fully Vaccinated | 58.1% | 57.5% | ≥70.0%1 | |
| Fully Vaccinated (millions) | 192.7 | 191.0 | ≥2321 | |
| New Cases per Day3🚩 | 71,029 | 70,265 | ≤5,0002 | |
| Hospitalized3 | 42,358 | 46,452 | ≤3,0002 | |
| Deaths per Day3 | 1,130 | 1,213 | ≤502 | |
| 1 Minimum to achieve "herd immunity" (estimated between 70% and 85%). 2my goals to stop daily posts, 37 day average for Cases, Currently Hospitalized, and Deaths 🚩 Increasing 7 day average week-over-week for Cases, Hospitalized, and Deaths ✅ Goal met. | ||||
IMPORTANT: For "herd immunity" most experts believe we need 70% to 85% of the total population fully vaccinated (or already had COVID). Note: COVID will probably stay endemic (at least for some time).
The following 20 states have between 50% and 59.9% fully vaccinated: Hawaii at 59.8%, Florida, Wisconsin, Nebraska, Iowa, Illinois, Michigan, Kentucky, South Dakota, Texas, Arizona, Kansas, Nevada, Alaska, Utah, North Carolina, Ohio, Montana, Oklahoma, and South Carolina at 50.1%.
Next up (total population, fully vaccinated according to CDC) are Indiana at 49.9%, Missouri at 49.8%, Georgia at 48.2%, and Arkansas at 48.1%.
 Click on graph for larger image.
This graph shows the daily (columns) and 7 day average (line) of positive tests reported.
FOMC Statement: Taper!
by Calculated Risk on 11/03/2021 02:03:00 PM
Fed Chair Powell press conference video here starting at 2:30 PM ET.
FOMC Statement:
The Federal Reserve is committed to using its full range of tools to support the U.S. economy in this challenging time, thereby promoting its maximum employment and price stability goals.
With progress on vaccinations and strong policy support, indicators of economic activity and employment have continued to strengthen. The sectors most adversely affected by the pandemic have improved in recent months, but the summer's rise in COVID-19 cases has slowed their recovery. Inflation is elevated, largely reflecting factors that are expected to be transitory. Supply and demand imbalances related to the pandemic and the reopening of the economy have contributed to sizable price increases in some sectors. Overall financial conditions remain accommodative, in part reflecting policy measures to support the economy and the flow of credit to U.S. households and businesses.
The path of the economy continues to depend on the course of the virus. Progress on vaccinations and an easing of supply constraints are expected to support continued gains in economic activity and employment as well as a reduction in inflation. Risks to the economic outlook remain.
The Committee seeks to achieve maximum employment and inflation at the rate of 2 percent over the longer run. With inflation having run persistently below this longer-run goal, the Committee will aim to achieve inflation moderately above 2 percent for some time so that inflation averages 2 percent over time and longer‑term inflation expectations remain well anchored at 2 percent. The Committee expects to maintain an accommodative stance of monetary policy until these outcomes are achieved. The Committee decided to keep the target range for the federal funds rate at 0 to 1/4 percent and expects it will be appropriate to maintain this target range until labor market conditions have reached levels consistent with the Committee's assessments of maximum employment and inflation has risen to 2 percent and is on track to moderately exceed 2 percent for some time. In light of the substantial further progress the economy has made toward the Committee's goals since last December, the Committee decided to begin reducing the monthly pace of its net asset purchases by $10 billion for Treasury securities and $5 billion for agency mortgage-backed securities. Beginning later this month, the Committee will increase its holdings of Treasury securities by at least $70 billion per month and of agency mortgage‑backed securities by at least $35 billion per month. Beginning in December, the Committee will increase its holdings of Treasury securities by at least $60 billion per month and of agency mortgage-backed securities by at least $30 billion per month. The Committee judges that similar reductions in the pace of net asset purchases will likely be appropriate each month, but it is prepared to adjust the pace of purchases if warranted by changes in the economic outlook. The Federal Reserve's ongoing purchases and holdings of securities will continue to foster smooth market functioning and accommodative financial conditions, thereby supporting the flow of credit to households and businesses.
In assessing the appropriate stance of monetary policy, the Committee will continue to monitor the implications of incoming information for the economic outlook. The Committee would be prepared to adjust the stance of monetary policy as appropriate if risks emerge that could impede the attainment of the Committee's goals. The Committee's assessments will take into account a wide range of information, including readings on public health, labor market conditions, inflation pressures and inflation expectations, and financial and international developments.
Voting for the monetary policy action were Jerome H. Powell, Chair; John C. Williams, Vice Chair; Thomas I. Barkin; Raphael W. Bostic; Michelle W. Bowman; Lael Brainard; Richard H. Clarida; Mary C. Daly; Charles L. Evans; Randal K. Quarles; and Christopher J. Waller.
emphasis added
The Market Impact of the Closure of Zillow Offers
by Calculated Risk on 11/03/2021 12:21:00 PM
Today, in the Real Estate Newsletter: The Market Impact of the Closure of Zillow Offers
Excerpt:
Many people are discussing the Zillow’s business decision to discontinue Zillow Offers. This was a essentially a house flipping program. My question is what - if any - will be the market impact of the closure.
...
But the bottom line is inventories are very low, mortgage rates are still historically low, and demographics are currently favorable for home buying.
If the housing market slows - for whatever reason - I think the slowdown will show up in active existing home inventory. This is why I track local market inventory so closely every month. Some markets have seen inventories increase, but overall active inventory was at a record low for September.
We should get some local October inventory numbers soon.
ISM® Services Index Increased to 66.7% in October
by Calculated Risk on 11/03/2021 10:05:00 AM
(Posted with permission). The October ISM® Services index was at 66.79%, up from 61.9% last month. The employment index decreased to 51.6%, from 53.0%. Note: Above 50 indicates expansion, below 50 contraction.
From the Institute for Supply Management: Services PMI® at 66.7%
October 2021 Services ISM® Report On Business®
Economic activity in the services sector grew in October for the 17th month in a row — with the rate of expansion setting a record for the fourth time in 2021 — say the nation's purchasing and supply executives in the latest Services ISM® Report On Business®.This was above the consensus forecast, however the employment index decreased to 51.6%, from 53.0% the previous month.
The report was issued today by Anthony Nieves, CPSM, C.P.M., A.P.P., CFPM, Chair of the Institute for Supply Management® (ISM®) Services Business Survey Committee: “In October, the Services PMI® registered another all-time high of 66.7 percent, 4.8 percentage points above September’s reading of 61.9 percent. This figure exceeds the former all-time high of 64.1 percent in July; previous records were set in May (64 percent) and March (63.7 percent). The data quickly explains the elevated Services PMI® reading, as two of the four equally weighted subindexes that directly factor into the composite index set all-time highs: The Business Activity Index reached 69.8 percent, an increase of 7.5 percentage points compared to the reading of 62.3 percent in September, and the New Orders Index hit 69.7 percent, up 6.2 percentage points from last month’s figure of 63.5 percent. (The other two subindexes are Employment and Supplier Deliveries, both also in expansion territory in October.)
emphasis added
ADP: Private Employment increased 571,000 in October
by Calculated Risk on 11/03/2021 08:19:00 AM
Private sector employment increased by 571,000 jobs from September to October according to the October ADP® National Employment ReportTM. Broadly distributed to the public each month, free of charge, the ADP National Employment Report is produced by the ADP Research Institute® in collaboration with Moody’s Analytics. The report, which is derived from ADP’s actual data of those who are on a company’s payroll, measures the change in total nonfarm private employment each month on a seasonally-adjusted basisThis was well above the consensus forecast of 400,000 for this report.
“The labor market showed renewed momentum last month, with a jump from the third quarter average of 385,000 monthly jobs added, marking nearly 5 million job gains this year,” said Nela Richardson, chief economist, ADP. “Service sector providers led the increase and the goods sector gains were broad based, reporting the strongest reading of the year. Large companies fueled the stronger recovery in October, marking the second straight month of impressive growth.”
Mark Zandi, chief economist of Moody’s Analytics, said, “The job market is revving back up as the Delta wave of the pandemic winds down. Job gains are accelerating across all industries, and especially among large companies. As long as the pandemic remains contained, more big job gains are likely in coming months.”
emphasis added
The BLS report will be released Friday, and the consensus is for 413 thousand non-farm payroll jobs added in October. The ADP report has not been very useful in predicting the BLS report.
MBA: Mortgage Applications Decrease in Latest Weekly Survey
by Calculated Risk on 11/03/2021 07:00:00 AM
From the MBA: Mortgage Applications Decrease in Latest MBA Weekly Survey
— Mortgage applications decreased 3.3 percent from one week earlier, according to data from the Mortgage Bankers Association’s (MBA) Weekly Mortgage Applications Survey for the week ending October 29, 2021.
... The Refinance Index decreased 4 percent from the previous week and was 33 percent lower than the same week one year ago. The seasonally adjusted Purchase Index decreased 2 percent from one week earlier. The unadjusted Purchase Index decreased 3 percent compared with the previous week and was 9 percent lower than the same week one year ago.
“Mortgage rates decreased for the first time since August, as concerns about supply-chain bottlenecks, waning consumer confidence, weaker economic growth, and rising inflation pushed Treasury yields lower. Most of the decline in rates came later in the week, which is likely why refinance applications declined to the lowest level since January 2020, and the overall share of activity fell to the lowest since July 2021,” said Joel Kan, MBA’s Associate Vice President of Economic and Industry Forecasting. “Government refinance applications fell for the sixth straight week, as it becomes evident that an increasing number of borrowers have already refinanced.”
Added Kan, “Purchase activity continues to be held back by high prices and low for-sale inventory, but current applications levels still point to healthy housing demand. MBA is forecasting for a record $1.6 billion in purchase mortgage originations this year, and sustained demand leading to another record year in 2022.”
...
The average contract interest rate for 30-year fixed-rate mortgages with conforming loan balances ($548,250 or less) decreased to 3.24 percent from 3.30 percent, with points remaining unchanged at 0.34 (including the origination fee) for 80 percent loan-to-value ratio (LTV) loans.
emphasis added
 Click on graph for larger image.
The first graph shows the refinance index since 1990.
With relatively low rates, the index remains somewhat elevated - but the recent bump in rates has slowed activity to the lowest level since January 2020.
The second graph shows the MBA mortgage purchase index
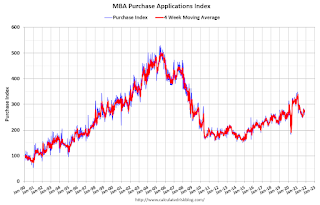 According to the MBA, purchase activity is down 9% year-over-year unadjusted.
Note: The year ago comparisons for the unadjusted purchase index are now difficult since purchase activity was strong in the second half of 2020.
Note: Red is a four-week average (blue is weekly).
Tuesday, November 02, 2021
Wednesday: FOMC Announcement, ADP Employment, ISM Services
by Calculated Risk on 11/02/2021 09:00:00 PM
Here is my FOMC Preview: Taper Announcement Expected.
Wednesday:
• At 7:00 AM ET, The Mortgage Bankers Association (MBA) will release the results for the mortgage purchase applications index.
• At 8:15 AM, The ADP Employment Report for October. This report is for private payrolls only (no government). The consensus is for 400,000 jobs added, down from 568,000 in September.
• At 10:00 AM, the ISM Services Index for October. The consensus is for a decrease to 59.5 from 61.9.
• At 2:00 PM, FOMC Meeting Announcement. The FOMC is expected to announce tapering of asset purchases at this meeting.
• At 2:30 PM, Fed Chair Jerome Powell holds a press briefing following the FOMC announcement.
October Vehicles Sales Increased to 13.0 Million SAAR
by Calculated Risk on 11/02/2021 06:29:00 PM
Wards Auto released their estimate of light vehicle sales for October. Wards Auto estimates sales of 12.99 million SAAR in October 2021 (Seasonally Adjusted Annual Rate), up 6.8% from the September sales rate, and down 20.8% from October 2020.
 Click on graph for larger image.
This graph shows light vehicle sales since 2006 from the BEA (blue) and Wards Auto's estimate for October (red).
The impact of COVID-19 was significant, and April 2020 was the worst month.
After April 2020, sales increased, and were close to sales in 2019 (the year before the pandemic).
Q3 2021 GDP Details on Residential and Commercial Real Estate
by Calculated Risk on 11/02/2021 05:35:00 PM
The BEA released the underlying details for the Q3 advance GDP report on Friday.
The BEA reported that investment in non-residential structures increased at a 2.4% annual pace in Q3. Note that weakness in non-residential structures started in 2019, before the pandemic.
Investment in petroleum and natural gas structures increased sharply in Q3 compared to Q2, and was up 67% year-over-year.
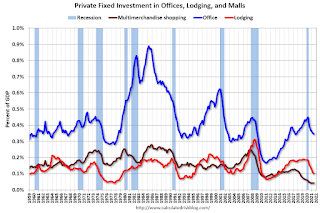
The first graph shows investment in offices, malls and lodging as a percent of GDP.
Investment in offices (blue) increased slightly in Q3, and was down 4.9% year-over-year.
Investment in multimerchandise shopping structures (malls) peaked in 2007 and was down about 2% year-over-year in Q3 - and near a record low as a percent of GDP. The vacancy rate for malls is still very high, so investment will probably stay low for some time.
Lodging investment decreased slightly in Q3 compared to Q2, and lodging investment was down 29% year-over-year.
 The second graph is for Residential investment components as a percent of GDP. According to the Bureau of Economic Analysis, RI includes new single family structures, multifamily structures, home improvement, Brokers’ commissions and other ownership transfer costs, and a few minor categories (dormitories, manufactured homes).
Even though investment in single family structures has increased from the bottom, single family investment is just approaching normal levels as a percent of GDP.
Investment in single family structures was $411 billion (SAAR) (about 1.8% of GDP), and up 38% year-over-year.
Investment in multi-family structures decreased slightly in Q3.
Investment in home improvement was at a $324 billion Seasonally Adjusted Annual Rate (SAAR) in Q2 (about 1.4% of GDP). Home improvement spending has been strong during the pandemic.
November 2nd COVID-19: 23 Days till Thanksgiving and Red Flags Flying
by Calculated Risk on 11/02/2021 02:50:00 PM
| COVID Metrics | ||||
|---|---|---|---|---|
| Today | Week Ago | Goal | ||
| Percent fully Vaccinated | 58.0% | 57.4% | ≥70.0%1 | |
| Fully Vaccinated (millions) | 192.6 | 190.7 | ≥2321 | |
| New Cases per Day3🚩 | 74,798 | 67,184 | ≤5,0002 | |
| Hospitalized3 | 42,186 | 47,283 | ≤3,0002 | |
| Deaths per Day3🚩 | 1,190 | 1,174 | ≤502 | |
| 1 Minimum to achieve "herd immunity" (estimated between 70% and 85%). 2my goals to stop daily posts, 37 day average for Cases, Currently Hospitalized, and Deaths 🚩 Increasing 7 day average week-over-week for Cases, Hospitalized, and Deaths ✅ Goal met. | ||||
IMPORTANT: For "herd immunity" most experts believe we need 70% to 85% of the total population fully vaccinated (or already had COVID). Note: COVID will probably stay endemic (at least for some time).
The following 22 states have between 50% and 59.9% fully vaccinated: Minnesota at 59.9%, Delaware, Hawaii, Florida, Wisconsin, Nebraska, Iowa, Illinois, Michigan, Kentucky, South Dakota, Texas, Arizona, Kansas, Nevada, Alaska, Utah, North Carolina, Ohio, Montana, Oklahoma, and South Carolina at 50.1%.
Next up (total population, fully vaccinated according to CDC) are Indiana at 49.9%, Missouri at 49.8%, Georgia at 48.2%, and Arkansas at 48.1%.
 Click on graph for larger image.
This graph shows the daily (columns) and 7 day average (line) of positive tests reported.
Update: Framing Lumber Prices Up Year-over-year
by Calculated Risk on 11/02/2021 11:56:00 AM
Here is another monthly update on framing lumber prices.
This graph shows CME random length framing futures through November 2nd.
 Click on graph for larger image in graph gallery.
There were supply constraints over the last year, for example, sawmills cut production and inventory at the beginning of the pandemic, and the West Coast fires in 2020 damaged privately-owned timberland (and maybe again in 2021).
HVS: Q3 2021 Homeownership and Vacancy Rates
by Calculated Risk on 11/02/2021 10:14:00 AM
The Census Bureau released the Residential Vacancies and Homeownership report for Q3 2021.
The results of this survey were significantly distorted by the pandemic in 2020.
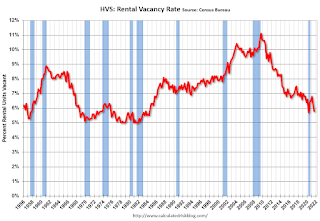
This report is frequently mentioned by analysts and the media to track household formation, the homeownership rate, and the homeowner and rental vacancy rates. However, there are serious questions about the accuracy of this survey.
This survey might show the trend, but I wouldn't rely on the absolute numbers. Analysts probably shouldn't use the HVS to estimate the excess vacant supply or household formation, or rely on the homeownership rate, except as a guide to the trend.
"National vacancy rates in the third quarter 2021 were 5.8 percent for rental housing and 0.9 percent for homeowner housing. The rental vacancy rate was 0.6 percentage points lower than the rate in the third quarter 2020 (6.4 percent) and 0.4 percentage points lower than the rate in the second quarter 2021 (6.2 percent).
The homeowner vacancy rate of 0.86 percent was lower than the rate in the third quarter 2020 (0.95 percent) and virtually the same as the rate in the second quarter 2021 (0.86 percent). (Note: the 0.86 percent and the 0.95 percent each round to 0.9 percent in the tables below).
The homeownership rate of 65.4 percent was 2.0 percentage points lower than the rate in the third quarter 2020 (67.4 percent) and virtually the same as the rate in the second quarter 2021 (65.4 percent). "
emphasis added
 Click on graph for larger image.
The Red dots are the decennial Census homeownership rates for April 1st 1990, 2000 and 2010. The Census Bureau will released data for 2020 soon.
The results starting in Q2 2020 were distorted by the pandemic.
 The HVS homeowner vacancy was unchanged at 0.9% in Q3.
 Once again - this probably shows the general trend, but I wouldn't rely on the absolute numbers.
CoreLogic: House Prices up 18% YoY in September
by Calculated Risk on 11/02/2021 08:00:00 AM
Notes: This CoreLogic House Price Index report is for September. The recent Case-Shiller index release was for August. The CoreLogic HPI is a three month weighted average and is not seasonally adjusted (NSA).
From CoreLogic: US Annual Home Price Growth Hits 18% in September as Supply and Demand Imbalances Intensify, CoreLogic Reports
CoreLogic® ... released the CoreLogic Home Price Index (HPI™) and HPI Forecast™ for September 2021.
Demand for homebuying remained strong through the end of the summer. However, the ongoing housing supply shortage has continued to drive up prices, which increased 18% year over year in September, to record highs creating additional challenges for entry into the homebuying market. High demand and low supply levels for entry-level homes, in particular, are sidelining many would-be first-time buyers.
As millennials continue to make up a large part of homebuying demand and flock to tech hubs like Seattle; San Jose, California and Austin, Texas, we may see this challenge intensify. This is reflected in a recent CoreLogic consumer survey, with 47.9% of this cohort stating they cannot afford to purchase a home in their preferred area.
“The pandemic led prospective buyers to seek detached homes in communities with lower population density, such as suburbs and exurbs,” said Frank Martell, president and CEO of CoreLogic. “As we head into 2022, we expect some moderation in the current pattern of flight away from urban cores as the pandemic wanes.”
...
Nationally, home prices increased 18% in September 2021, compared to September 2020. On a month-over-month basis, home prices increased by 1.1% compared to August 2021.
...
In September, appreciation of detached properties (19.6%) was 7.4 percentage points higher than that of attached properties (12.2%).
emphasis added

