by Calculated Risk on 3/29/2022 10:45:00 AM
Tuesday, March 29, 2022
Comments on January Case-Shiller and FHFA House Price Increases
Today, in the Calculated Risk Real Estate Newsletter: Case-Shiller National Index up 19.2% Year-over-year in January
Excerpt:
This graph below shows existing home months-of-supply (inverted, from the NAR) vs. the seasonally adjusted month-to-month price change in the Case-Shiller National Index (both since January 1999 through January 2022).
Note that the months-of-supply is not seasonally adjusted.
There is a clear relationship, and this is no surprise (but interesting to graph). If months-of-supply is high, prices decline. If months-of-supply is very low (like now), prices rise quickly.
In January, the months-of-supply was at 1.6 months, and the Case-Shiller National Index (SA) increased 1.56% month-over-month. The black arrow points to the January 2022 dot. In the February existing home sales report, the NAR reported months-of-supply increased to 1.7 months.
My sense is the Case-Shiller National annual growth rate of 19.98% in August was probably the peak YoY growth rate, however, since the normal level of inventory is probably in the 4 to 6 months range - we’d have to see a significant increase in inventory to sharply slow price increases, and that is why I’m focused on inventory!
Note: I’ll have more on real prices, price-to-rent and affordability tomorrow.emphasis added
BLS: Job Openings "little changed" at 11.3 million in February
by Calculated Risk on 3/29/2022 10:05:00 AM
From the BLS: Job Openings and Labor Turnover Summary
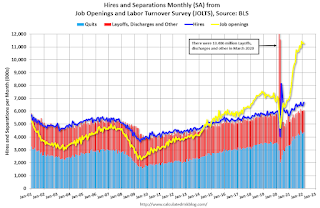
The number of job openings was little changed at 11.3 million on the last business day of February, the U.S. Bureau of Labor Statistics reported today. Hires edged up to 6.7 million while total separations were little changed at 6.1 million. Within separations, the quits rate was little changed at 2.9 percent and the layoffs and discharges rate was unchanged at 0.9 percent.The following graph shows job openings (yellow line), hires (dark blue), Layoff, Discharges and other (red column), and Quits (light blue column) from the JOLTS.
emphasis added
This series started in December 2000.
Note: The difference between JOLTS hires and separations is similar to the CES (payroll survey) net jobs headline numbers. This report is for February, the employment report this Friday will be for March.
 Click on graph for larger image.
Note that hires (dark blue) and total separations (red and light blue columns stacked) are usually pretty close each month. This is a measure of labor market turnover. When the blue line is above the two stacked columns, the economy is adding net jobs - when it is below the columns, the economy is losing jobs.
The huge spike in layoffs and discharges in March 2020 are labeled, but off the chart to better show the usual data.
Jobs openings decreased slightly in February to 11.266 million from 11.283 million in January.
The number of job openings (yellow) were up 43% year-over-year.
Quits were up 27% year-over-year. These are voluntary separations. (See light blue columns at bottom of graph for trend for "quits").
Case-Shiller: National House Price Index increased 19.2% year-over-year in January
by Calculated Risk on 3/29/2022 09:16:00 AM
S&P/Case-Shiller released the monthly Home Price Indices for January ("January" is a 3-month average of November, December and January prices).
This release includes prices for 20 individual cities, two composite indices (for 10 cities and 20 cities) and the monthly National index.
From S&P: S&P Corelogic Case-Shiller Index Reports 19.2% Annual Home Price Gain to Start 2022
The S&P CoreLogic Case-Shiller U.S. National Home Price NSA Index, covering all nine U.S. census divisions, reported a 19.2% annual gain in January, up from 18.9% in the previous month. The 10-City Composite annual increase came in at 17.5%, up from 17.1% in the previous month. The 20-City Composite posted a 19.1% year-over-year gain, up from 18.6% in the previous month.
Phoenix, Tampa, and Miami reported the highest year-over-year gains among the 20 cities in January. Phoenix led the way with a 32.6% year-over-year price increase, followed by Tampa with a 30.8% increase and Miami with a 28.1% increase. Sixteen of the 20 cities reported higher price increases in the year ending January 2022 versus the year ending December 2021.
...
Before seasonal adjustment, the U.S. National Index posted an 1.1% month-over-month increase in January, while the 10-City and 20-City Composites both posted increases of 1.4%.
After seasonal adjustment, the U.S. National Index posted a month-over-month increase of 1.6%, and the 10-City and 20-City Composites both posted increases of 1.8%.
In January, all 20 cities reported increases before and after seasonal adjustments.
“Home price changes in January 2022 continued the strength we had observed for much of the prior year,” says Craig J. Lazzara, Managing Director at S&P DJI. “The National Composite Index recorded a gain of 19.2% for the 12 months ended in January 2022; the 10- and 20-City Composites rose 17.5% and 19.1%, respectively. All three composites reflect a small acceleration of price growth for January 2022.
“Last fall we observed that home prices, although continuing to rise quite sharply, had begun to decelerate. Even that modest deceleration was on pause in January. The 19.2% year-over-year change for January was the fourth-largest reading in 35 years of history.”
emphasis added
 Click on graph for larger image.
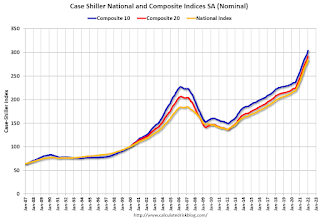
 The first graph shows the nominal seasonally adjusted Composite 10, Composite 20 and National indices (the Composite 20 was started in January 2000).
The Composite 10 index is up 1.4% in January (SA).
The Composite 20 index is up 1.4% (SA) in January.
The National index is 54% above the bubble peak (SA), and up 1.1% (SA) in January. The National index is up 108% from the post-bubble low set in February 2012 (SA).
 The second graph shows the year-over-year change in all three indices.
The Composite 10 SA is up 17.5% year-over-year. The Composite 20 SA is up 19.1% year-over-year.
The National index SA is up 19.2% year-over-year.
Price increases were above expectations. I'll have more later.
Monday, March 28, 2022
Tuesday: Case-Shiller, Job Openings
by Calculated Risk on 3/28/2022 07:11:00 PM
From Matthew Graham at Mortgage News Daily: Uneventful Start This Week as Rates Flirt With 5%
Last week's big news was the rapid jump in rates. In fact, it was right in line with the worst week in decades in terms of the total increase in the average 30yr fixed rate. On that note, June 17-21, 2013 saw rates rise 0.52% compared to last week's 0.49%. Because rates are quoted in 0.125% increments, this would be a hit of 0.50% to prospective borrowers in either case. ... In more specific terms, the average lender is effectively unchanged when it comes to top tier 30yr fixed scenarios with quotes currently ranging from 4.875 to 5.125% in a majority of cases. [30 year fixed 4.95%]Tuesday:
emphasis added
• At 9:00 AM ET, S&P/Case-Shiller House Price Index for January. The consensus is for a 18.3% year-over-year increase in the Comp 20 index.
• Also at 9:00 AM, FHFA House Price Index for January 2021. This was originally a GSE only repeat sales, however there is also an expanded index.
• At 10:00 AM, Job Openings and Labor Turnover Survey for February from the BLS.
On COVID (focus on hospitalizations and deaths):
| COVID Metrics | ||||
|---|---|---|---|---|
| Now | Week Ago | Goal | ||
| Percent fully Vaccinated | 65.5% | --- | ≥70.0%1 | |
| Fully Vaccinated (millions) | 217.4 | --- | ≥2321 | |
| New Cases per Day3🚩 | 27,775 | 27,104 | ≤5,0002 | |
| Hospitalized3 | 12,487 | 17,168 | ≤3,0002 | |
| Deaths per Day3 | 690 | 927 | ≤502 | |
| 1 Minimum to achieve "herd immunity" (estimated between 70% and 85%). 2my goals to stop daily posts, 37-day average for Cases, Currently Hospitalized, and Deaths 🚩 Increasing 7-day average week-over-week for Cases, Hospitalized, and Deaths ✅ Goal met. | ||||
 Click on graph for larger image.
This graph shows the daily (columns) and 7-day average (line) of deaths reported.
Housing Inventory Has Bottomed
by Calculated Risk on 3/28/2022 09:40:00 AM
Today, in the Calculated Risk Real Estate Newsletter: Housing Inventory Has Bottomed
A brief excerpt:
Altos Research reports inventory up 2.4% last week ...There is much more in the article. You can subscribe at https://calculatedrisk.substack.com/
As of March 25th, inventory was at 253 thousand (7-day average), compared to 248 thousand the prior week. Inventory was UP 2.4% from the previous week.
Last year inventory bottomed seasonally in April 2021 - very late in the year. This year, by this measure, inventory bottomed seasonally at the beginning of March.
Inventory is still very low. Compared to the same week in 2021, inventory is down 19.0%, and compared to the same week in 2020, and inventory is down 66.1% from 747 thousand.
One of the keys will be to watch the year-over-year change each week to see if the declines are decreasing. Here is a table of the year-over-year change by week since the beginning of the year.
Week Ending YoY Change 12/31/2021 -30.0% 1/7/2022 -26.0% 1/14/2022 -28.6% 1/21/2022 -27.1% 1/28/2022 -25.9% 2/4/2022 -27.9% 2/11/2022 -27.5% 2/18/2022 -25.8% 2/25/2022 -24.9% 3/4/2022 -24.2% 3/11/2022 -21.7% 3/18/2022 -21.7% 3/25/2022 -19.0%
Now we need to watch if the YoY change continues to decrease. Based on the current trend, it is possible inventory will be up YoY sometime in the second half of 2022.
Altos Research CEO Mike Simonsen discusses this data regularly on Youtube.
Six High Frequency Indicators for the Economy
by Calculated Risk on 3/28/2022 08:39:00 AM
These indicators are mostly for travel and entertainment. It is interesting to watch these sectors recover as the pandemic subsides.
The TSA is providing daily travel numbers.
This data is as of March 27th.
 Click on graph for larger image.
This data shows the 7-day average of daily total traveler throughput from the TSA for 2019 (Light Blue), 2020 (Black), 2021 (Blue) and 2022 (Red).
The dashed line is the percent of 2019 for the seven-day average.
The 7-day average is down 10.6% from the same day in 2019 (89.4% of 2019). (Dashed line)
The second graph shows the 7-day average of the year-over-year change in diners as tabulated by OpenTable for the US and several selected cities.
 Thanks to OpenTable for providing this restaurant data:
This data is updated through March 26, 2022.
This data is "a sample of restaurants on the OpenTable network across all channels: online reservations, phone reservations, and walk-ins. For year-over-year comparisons by day, we compare to the same day of the week from the same week in the previous year."
Dining was mostly moving sideways but declined during the winter wave of COVID and is now increasing. The 7-day average for the US is down 4% compared to 2019.
 This data shows domestic box office for each week and the median for the years 2016 through 2019 (dashed light blue).
 Note that the data is usually noisy week-to-week and depends on when blockbusters are released.
Movie ticket sales were at $102 million last week, down about 46% from the median for the week.
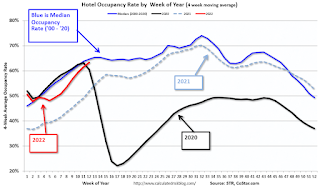 This graph shows the seasonal pattern for the hotel occupancy rate using the four-week average.
 The red line is for 2022, black is 2020, blue is the median, and dashed light blue is for 2021.
This data is through March 19th. The occupancy rate was down 3.7% compared to the same week in 2019.
Notes: Y-axis doesn't start at zero to better show the seasonal change.
This graph is from Apple mobility. From Apple: "This data is generated by counting the number of requests made to Apple Maps for directions in select countries/regions, sub-regions, and cities." This is just a general guide - people that regularly commute probably don't ask for directions.
 This data is through March 26th
 The graph is the running 7-day average to remove the impact of weekends.
IMPORTANT: All data is relative to January 13, 2020. This data is NOT Seasonally Adjusted. People walk and drive more when the weather is nice, so I'm just using the transit data.
According to the Apple data directions requests, public transit in the 7-day average for the US is at 126% of the January 2020 level.
Here is some interesting data on New York subway usage (HT BR).
 This graph is from Todd W Schneider.
 This data is through Friday, March 25th.
He notes: "Data updates weekly from the MTA’s public turnstile data, usually on Saturday mornings".
Sunday, March 27, 2022
Sunday Night Futures
by Calculated Risk on 3/27/2022 09:15:00 PM
Weekend:
• Schedule for Week of March 27, 2022
Monday:
• At 10:30 AM ET, Dallas Fed Survey of Manufacturing Activity for March. This is the last of the regional surveys for March.
From CNBC: Pre-Market Data and Bloomberg futures S&P 500 are down 15 and DOW futures are down 100 (fair value).
Oil prices were up over the last week with WTI futures at $109.92 per barrel and Brent at $116.63 per barrel. A year ago, WTI was at $61, and Brent was at $64 - so WTI oil prices are up 80% year-over-year.
Here is a graph from Gasbuddy.com for nationwide gasoline prices. Nationally prices are at $4.22 per gallon. A year ago prices were at $2.84 per gallon, so gasoline prices are up $1.38 per gallon year-over-year.
Census: Record 37.9% of adult population in the United States has a bachelor’s degree or higher
by Calculated Risk on 3/27/2022 12:23:00 PM
This was released last month by the Census Bureau: Census Bureau Releases New Educational Attainment Data
In 2021, the highest level of education of the population age 25 and older in the United States was distributed as follows:
• 8.9% had less than a high school diploma or equivalent.
• 27.9% had high school graduate as their highest level of school completed.
• 14.9% had completed some college but not a degree.
• 10.5% had an associate degree as their highest level of school completed.
• 23.5% had a bachelor’s degree as their highest degree.
• 14.4% had completed an advanced degree such as a master’s degree, professional degree or doctoral degree.
emphasis added
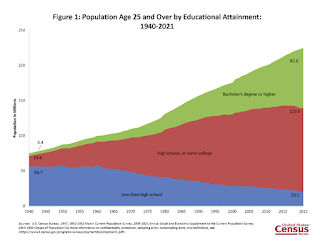 This graph shows the number of adults, 25 years and older, with less than high school education, high school or some college, and a bachelor's degree or higher since 1940.
 In 1940, about 76% of the adult population (over 25) had less than a high school education. That has declined to less than 9% now.
Saturday, March 26, 2022
Real Estate Newsletter Articles this Week
by Calculated Risk on 3/26/2022 02:11:00 PM
At the Calculated Risk Real Estate Newsletter this week:
• New Home Sales and Cancellations
• February New Home Sales: Few Completed Inventory, High Number of Homes Under Construction
• Mortgage Rates Moving Closer to 5%
• Final Look at Local Housing Markets in February
This is usually published several times a week and provides more in-depth analysis of the housing market.
The blog will continue as always!
You can subscribe at https://calculatedrisk.substack.com/
Schedule for Week of March 27, 2022
by Calculated Risk on 3/26/2022 08:11:00 AM
The key report scheduled for this week is the March employment report on Friday.
Other key reports include the 3rd estimate of Q4 GDP, February Personal Income & Outlays, January Case-Shiller house prices and March Auto Sales.
For manufacturing, the March Dallas Fed survey and the ISM Manufacturing survey will be released.
10:30 AM: Dallas Fed Survey of Manufacturing Activity for March. This is the last of the regional surveys for March.
 9:00 AM: S&P/Case-Shiller House Price Index for January.
This graph shows the year-over-year change for the Case-Shiller National, Composite 10 and Composite 20 indexes, through the most recent report (the Composite 20 was started in January 2000).
The consensus is for a 18.3% year-over-year increase in the Comp 20 index.
9:00 AM: FHFA House Price Index for January 2021. This was originally a GSE only repeat sales, however there is also an expanded index.
 10:00 AM ET: Job Openings and Labor Turnover Survey for February from the BLS.
 This graph shows job openings (yellow line), hires (purple), Layoff, Discharges and other (red column), and Quits (light blue column) from the JOLTS.
Jobs openings decreased in January to 11.3 million from 11.4 million in December.
7:00 AM ET: The Mortgage Bankers Association (MBA) will release the results for the mortgage purchase applications index.
8:15 AM: The ADP Employment Report for March. This report is for private payrolls only (no government). The consensus is for 438,000 payroll jobs added in March, down from 475,000 added in February.
8:30 AM, Gross Domestic Product, 4th quarter 2021 (Third estimate). The consensus is that real GDP increased 7.1% annualized in Q4.
8:30 AM: The initial weekly unemployment claims report will be released. The consensus is for an increase to 195 thousand from 187 thousand last week.
8:30 AM: Personal Income and Outlays for February. The consensus is for a 0.5% increase in personal income, and for a 0.5% increase in personal spending. And for the Core PCE price index to increase 0.4%.
9:45 AM: Chicago Purchasing Managers Index for March. The consensus is for a reading of 56.6, up from 56.3 in February.
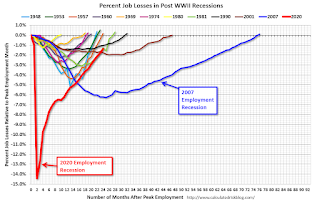 8:30 AM: Employment Report for March. The consensus is for 475,000 jobs added, and for the unemployment rate to decrease to 3.7%.
There were 678,000 jobs added in February, and the unemployment rate was at 3.8%.
This graph shows the job losses from the start of the employment recession, in percentage terms.
The current employment recession was by far the worst recession since WWII in percentage terms. However, the current employment recession, 24 months after the onset, is now significantly better than the worst of the "Great Recession".
10:00 AM: ISM Manufacturing Index for March. The consensus is for the ISM to be at 58.6, unchanged from 58.6 in February.
10:00 AM: Construction Spending for February. The consensus is for a 0.9% increase in construction spending.
 All Day: Light vehicle sales for March. The consensus is for light vehicle sales to be 14.1 million SAAR in March, unchanged from 14.1 million in February (Seasonally Adjusted Annual Rate).
This graph shows light vehicle sales since the BEA started keeping data in 1967. The dashed line is the February sales rate.
Friday, March 25, 2022
COVID Update: March 25, 2022; Deaths at 732 per Day, Lowest Since August 2021
by Calculated Risk on 3/25/2022 09:29:00 PM
Last June, new cases per day dropped to 8,000, hospitalizations fell to 12,000, and deaths were at 250 per day. Hospitalizations are approaching the June levels.
On COVID (focus on hospitalizations and deaths):
| COVID Metrics | ||||
|---|---|---|---|---|
| Now | Week Ago | Goal | ||
| Percent fully Vaccinated | 65.5% | --- | ≥70.0%1 | |
| Fully Vaccinated (millions) | 217.3 | --- | ≥2321 | |
| New Cases per Day3 | 27,784 | 28,007 | ≤5,0002 | |
| Hospitalized3 | 14,768 | 19,249 | ≤3,0002 | |
| Deaths per Day3 | 732 | 1,042 | ≤502 | |
| 1 Minimum to achieve "herd immunity" (estimated between 70% and 85%). 2my goals to stop daily posts, 37-day average for Cases, Currently Hospitalized, and Deaths 🚩 Increasing 7-day average week-over-week for Cases, Hospitalized, and Deaths ✅ Goal met. | ||||
 Click on graph for larger image.
This graph shows the daily (columns) and 7-day average (line) of deaths reported.
Freddie Mac: Mortgage Serious Delinquency Rate decreased in February
by Calculated Risk on 3/25/2022 12:33:00 PM
Freddie Mac reported that the Single-Family serious delinquency rate in February was 0.99%, down from 1.06% in January. Freddie's rate is down year-over-year from 2.52% in January 2021.
Freddie's serious delinquency rate peaked in February 2010 at 4.20% following the housing bubble and peaked at 3.17% in August 2020 during the pandemic.
These are mortgage loans that are "three monthly payments or more past due or in foreclosure".

Mortgages in forbearance are being counted as delinquent in this monthly report but are not reported to the credit bureaus.
This is very different from the increase in delinquencies following the housing bubble. Lending standards have been fairly solid over the last decade, and most of these homeowners have equity in their homes - and they will be able to restructure their loans once (if) they are employed.
Also - for multifamily - delinquencies were at 0.08%, down from the peak of 0.20% in April 2021.
Q1 GDP Forecasts: Under 1%
by Calculated Risk on 3/25/2022 12:00:00 PM
From BofA:
Our 1Q GDP tracking estimate moved down to 1.0% qoq saar from 1.6% previously, reflecting recent weaker-than-expected housing and inventory data. 4Q 2021 GDP is likely to get revised up modestly to 7.2% qoq saar from 7.0% qoq saar in the third and final release next week. [March 25 estimate]From Goldman:
emphasis added
Following today’s data,we left our Q1 GDP tracking estimate unchanged on a rounded basis at +0.5% (qoq ar). [March 24 estimate]And from the Altanta Fed: GDPNow
The GDPNow model estimate for real GDP growth (seasonally adjusted annual rate) in the first quarter of 2022 is 0.9 percent on March 24, down from 1.3 percent on March 17. After recent releases from the US Census Bureau and the National Association of Realtors, the nowcast of first-quarter real gross private domestic investment growth decreased from -4.2 percent to -5.8 percent. [March 24 estimate]
NAR: Pending Home Sales Decreased 4.1% in February
by Calculated Risk on 3/25/2022 10:09:00 AM
From CNBC: Pending home sales sink in February, setting a grim tone as housing market enters key spring season
In a grim sign for the housing market’s busiest season, pending home sales, which measure signed contracts on existing homes, fell 4.1% in February compared with January, according to the National Association of Realtors.This was well below expectations of a 1.5% increase for this index. Note: Contract signings usually lead sales by about 45 to 60 days, so this would usually be for closed sales in March and April.
Sales were down 5.4% compared with February 2021. Analysts were expecting a slight gain. This is the fourth straight month of declines in pending sales, which are an indicator of future closings, one to two months out.
...
Regionally, pending sales rose 1.9% month-to-month in the Northeast but were down 9.2% from a year ago. In the Midwest, sales decreased 6.0% for the month and were down 5.2% from February 2021. In the South, sales fell 4.4% monthly and 4.3% annually, and in the West they were down 5.4% for the month and 5.3% from a year ago.
emphasis added
Thursday, March 24, 2022
Friday: Pending Home Sales
by Calculated Risk on 3/24/2022 08:41:00 PM
Friday:
• At 10:00 AM ET, Pending Home Sales Index for February. The consensus is for a 1.5% increase in the index.
• Also, at 10:00 AM, University of Michigan's Consumer sentiment index (Final for March). The consensus is for a reading of 59.7.
• Also, at 10:00 AM, State Employment and Unemployment (Monthly), February 2022
On COVID (focus on hospitalizations and deaths):
| COVID Metrics | ||||
|---|---|---|---|---|
| Now | Week Ago | Goal | ||
| Percent fully Vaccinated | 65.4% | --- | ≥70.0%1 | |
| Fully Vaccinated (millions) | 217.3 | --- | ≥2321 | |
| New Cases per Day3 | 27,134 | 28,695 | ≤5,0002 | |
| Hospitalized3 | 15,227 | 20,978 | ≤3,0002 | |
| Deaths per Day3 | 749 | 1,063 | ≤502 | |
| 1 Minimum to achieve "herd immunity" (estimated between 70% and 85%). 2my goals to stop daily posts, 37-day average for Cases, Currently Hospitalized, and Deaths 🚩 Increasing 7-day average week-over-week for Cases, Hospitalized, and Deaths ✅ Goal met. | ||||
Hotels: Occupancy Rate Down 4% Compared to Same Week in 2019
by Calculated Risk on 3/24/2022 04:42:00 PM
Lifted by spring break travel, U.S. hotel performance rose from the previous week and showed improved comparisons against 2019, according to STR‘s latest data through March 19.The following graph shows the seasonal pattern for the hotel occupancy rate using the four-week average.
March 13-19, 2022 (percentage change from comparable week in 2019*):
• Occupancy: 66.9% (-3.7%)
• Average daily rate (ADR): $151.63 (+13.6%)
• Revenue per available room (RevPAR): $101.44 (+9.5%)
*Due to the pandemic impact, STR is measuring recovery against comparable time periods from 2019.
emphasis added
 Click on graph for larger image.
The red line is for 2022, black is 2020, blue is the median, and dashed light blue is for 2021.
New Home Sales and Cancellations
by Calculated Risk on 3/24/2022 02:23:00 PM
Today, in the Calculated Risk Real Estate Newsletter: New Home Sales and Cancellations
Brief excerpt:
At first glance, we might think that new home sales, as reported by the Census Bureau, would be impacted by rising mortgage rates sooner than existing home sales. This is because new home sales are reported when the contract is signed, but existing home sales are reported when the transaction closes.There is much more in the newsletter.
However, with the sharp increase in mortgage rates, we might see more cancellations for the homebuilders, and cancellations confuse the timing issue.When looking at new home sales, we are interested in net sales, but the Census Bureau reports gross new sales. A simple equation would be:
Sales (net) = Sales (gross) – Cancellations + Sales of earlier cancellations.
In the long run, the cancellation terms balance out, and the Census Bureau numbers are what we want. In other words, Sales(net) = sales(gross). But in the short run, when cancellations increase, the Census Bureau overestimates sales; and when cancellations decrease, the Census Bureau underestimates sales.
...
Currently cancellation rates are below normal for the home builders. Here is a table of selected public builders and the currently reported cancellation rate (I’m still gathering data).
As an example, Toll Brothers just announced a cancellation rate of 4.3%, up from 3.3%, but well below their historical rate of 7%. During the housing bust, Toll Brothers cancellation rates peaked close to 40%.
You can subscribe at https://calculatedrisk.substack.com/.
Black Knight: National Mortgage Delinquency Rate Increased in February
by Calculated Risk on 3/24/2022 11:19:00 AM
Note: At the beginning of the pandemic, the delinquency rate increased sharply. Loans in forbearance are counted as delinquent in this survey, but those loans are not reported as delinquent to the credit bureaus. Foreclosures are starting to increase following the end of the moratorium, but are at very low levels (see: Delinquencies, Foreclosures and REO) for a discussion of rising foreclosures, and why this isn't a concern)
From Black Knight: February Uptick in Early-Stage Delinquencies Drives First Increase in Past- Due Mortgages in Nine Months; Foreclosure Starts Fall 24% Following January Spike
• Though past-due loans edged higher (+1.8%) in February, the national delinquency rate remains near pre-pandemic levels heading into March, a month known for strong seasonal performance improvementsAccording to Black Knight's First Look report, the percent of loans delinquent increased 1.8% in February compared to January and decreased 44% year-over-year.
• February’s increase was driven by a rise of 97,000 in early-stage delinquencies – which nevertheless remain well below pre-pandemic levels
• At the same time, the number of seriously delinquent mortgages (those 90 or more days past due) fell by 72,000 as borrowers leaving forbearance plans continue to return to making payments
• After seeing a sizable spike in January, foreclosure starts pulled back by 24%, with the month’s 25,000 starts 25% below February 2020 levels, prior to the onset of pandemic-related economic stress
• Likewise, despite a 39,000 increase in the number of loans in active foreclosure, the population remains 32% below February 2020 levels
• Prepayment activity – as reflected in single-month mortality – dropped another 11% in February, hitting a nearly three-year low as rising rates continue to impact refinance volumes
emphasis added
The percent of loans in the foreclosure process increased 9% in February and were down 3% over the last year.
Black Knight reported the U.S. mortgage delinquency rate (loans 30 or more days past due, but not in foreclosure) was 3.36% in February, down from 3.30% in January.
The percent of loans in the foreclosure process increased in February to 0.31%, from 0.28% in January.
The number of delinquent properties, but not in foreclosure, is down 1,403,000 properties year-over-year, and the number of properties in the foreclosure process is down 6,000 properties year-over-year.
| Black Knight: Percent Loans Delinquent and in Foreclosure Process | ||||
|---|---|---|---|---|
| Feb 2022 | Jan 2022 | Feb 2021 | Feb 2020 | |
| Delinquent | 3.36% | 3.30% | 6.00% | 3.28% |
| In Foreclosure | 0.31% | 0.28% | 0.32% | 0.45% |
| Number of properties: | ||||
| Number of properties that are delinquent, but not in foreclosure: | 1,783,000 | 1,758,000 | 3,186,000 | 1,737,000 |
| Number of properties in foreclosure pre-sale inventory: | 162,000 | 149,000 | 168,000 | 239,000 |
| Total Properties | 1,946,000 | 1,907,000 | 3,354,000 | 1,976,000 |
Weekly Initial Unemployment Claims Decrease to 187,000; Lowest Since 1969
by Calculated Risk on 3/24/2022 08:34:00 AM
The DOL reported:
In the week ending March 19, the advance figure for seasonally adjusted initial claims was 187,000, a decrease of 28,000 from the previous week's revised level. This is the lowest level for initial claims since September 6, 1969 when it was 182,000. The previous week's level was revised up by 1,000 from 214,000 to 215,000. The 4-week moving average was 211,750, a decrease of 11,500 from the previous week's revised average. The previous week's average was revised up by 250 from 223,000 to 223,250.The following graph shows the 4-week moving average of weekly claims since 1971.
emphasis added
 Click on graph for larger image.
The dashed line on the graph is the current 4-week average. The four-week average of weekly unemployment claims decreased to 211,750.
The previous week was revised up.
Weekly claims were lower than the consensus forecast.
MBA: Median Mortgage Application Payment Up 8.3% from January
by Calculated Risk on 3/24/2022 07:00:00 AM
This is a new monthly affordability index from the Mortgage Bankers Association (MBA).
From the MBA: Median Mortgage Application Payment Jumped 8.3 Percent in February to $1,653
Homebuyer affordability decreased in February, with the national median payment applied for by applicants jumping 8.3 percent to $1,653 from $1,526 in January. This is according to the Mortgage Bankers Association's (MBA) new Purchase Applications Payment Index (PAPI), which measures how new monthly mortgage payments vary across time – relative to income – using data from MBA’s Weekly Applications Survey (WAS).
“Low unemployment has spurred strong income growth in early 2022, but homebuyer affordability has decreased due to the quick rise in mortgage rates amidst steep home-price growth,” said Edward Seiler, MBA's Associate Vice President, Housing Economics, and Executive Director, Research Institute for Housing America. “The 30-year fixed-rate mortgage spiked 73 basis points from December 2021 through February 2022. Together with increased loan application amounts, a mortgage applicant’s median principal and interest payment in February jumped $127 from January and $337 from one year ago.”
An increase in MBA’s PAPI – indicative of declining borrower affordability conditions – means that the mortgage payment to income ratio (PIR) is higher due to increasing application loan amounts, rising mortgage rates, or a decrease in earnings. A decrease in the PAPI – indicative of improving borrower affordability conditions – occurs when loan application amounts decrease, mortgage rates decrease, or earnings increase.
emphasis added
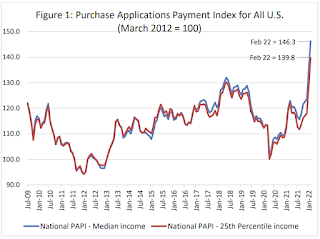 Click on graph for larger image.
This graph shows the MBA's PAPI since 2009.
The national PAPI (Figure 1) increased 8.3 percent to 146.3 in February 2022 from 135.1 in January 2022, meaning payments on new mortgages take up a larger share of a typical person’s income. Compared to February 2021 (120.0), the index jumped 21.9 percent. For borrowers applying for lower-payment mortgages (the 25th percentile), the national mortgage payment increased 9.8 percent to $1,094 from $996 in January 2022.This will increase further in March with the recent sharp increase in mortgage rates.


