by Calculated Risk on 11/03/2022 08:33:00 AM
Thursday, November 03, 2022
Weekly Initial Unemployment Claims at 217,000
The DOL reported:
In the week ending October 29, the advance figure for seasonally adjusted initial claims was 217,000, a decrease of 1,000 from the previous week's revised level. The previous week's level was revised up by 1,000 from 217,000 to 218,000. The 4-week moving average was 218,750, a decrease of 500 from the previous week's revised average. The previous week's average was revised up by 250 from 219,000 to 219,250.The following graph shows the 4-week moving average of weekly claims since 1971.
emphasis added
 Click on graph for larger image.
The dashed line on the graph is the current 4-week average. The four-week average of weekly unemployment claims decreased to 218,750.
The previous week was revised up.
Weekly claims were lower than the consensus forecast.
Wednesday, November 02, 2022
Thursday: Unemployment Claims, Trade Deficit, ISM Services
by Calculated Risk on 11/02/2022 08:29:00 PM
Thursday:
• At 8:30 AM ET, The initial weekly unemployment claims report will be released. The consensus is for an increase to 222 thousand from 217 thousand last week.
• Also at 8:30 AM, Trade Balance report for September from the Census Bureau. The consensus is for the deficit to be $72.1 billion in September, from $67.4 billion in August.
• At 10:00 AM, the ISM Services Index for October. The consensus is for a decrease to 55.5 from 56.7.
Fed's Powell: "Ultimate level of interest rates will be higher than previously expected"
by Calculated Risk on 11/02/2022 04:28:00 PM
A quick note ... this was the key sentence from Fed Chair Powell's press conference: "the ultimate level of interest rates will be higher than previously expected".
Powell also said that "At some point it will be appropriate to slow the rate of increases", but he said that might be in December or in 2023.
Overall his comments were hawkish.
FOMC Statement: Raise Rates 75 bp; "Ongoing increases appropriate"
by Calculated Risk on 11/02/2022 02:03:00 PM
Fed Chair Powell press conference video here or on YouTube here, starting at 2:30 PM ET.
FOMC Statement:
Recent indicators point to modest growth in spending and production. Job gains have been robust in recent months, and the unemployment rate has remained low. Inflation remains elevated, reflecting supply and demand imbalances related to the pandemic, higher food and energy prices, and broader price pressures.
Russia's war against Ukraine is causing tremendous human and economic hardship. The war and related events are creating additional upward pressure on inflation and are weighing on global economic activity. The Committee is highly attentive to inflation risks.
The Committee seeks to achieve maximum employment and inflation at the rate of 2 percent over the longer run. In support of these goals, the Committee decided to raise the target range for the federal funds rate to 3-3/4 to 4 percent. The Committee anticipates that ongoing increases in the target range will be appropriate in order to attain a stance of monetary policy that is sufficiently restrictive to return inflation to 2 percent over time. In determining the pace of future increases in the target range, the Committee will take into account the cumulative tightening of monetary policy, the lags with which monetary policy affects economic activity and inflation, and economic and financial developments. In addition, the Committee will continue reducing its holdings of Treasury securities and agency debt and agency mortgage-backed securities, as described in the Plans for Reducing the Size of the Federal Reserve's Balance Sheet that were issued in May. The Committee is strongly committed to returning inflation to its 2 percent objective.
In assessing the appropriate stance of monetary policy, the Committee will continue to monitor the implications of incoming information for the economic outlook. The Committee would be prepared to adjust the stance of monetary policy as appropriate if risks emerge that could impede the attainment of the Committee's goals. The Committee's assessments will take into account a wide range of information, including readings on public health, labor market conditions, inflation pressures and inflation expectations, and financial and international developments.
Voting for the monetary policy action were Jerome H. Powell, Chair; John C. Williams, Vice Chair; Michael S. Barr; Michelle W. Bowman; Lael Brainard; James Bullard; Susan M. Collins; Lisa D. Cook; Esther L. George; Philip N. Jefferson; Loretta J. Mester; and Christopher J. Waller.
emphasis added
First Look at 2023 Housing Forecasts
by Calculated Risk on 11/02/2022 12:49:00 PM
Today, in the Calculated Risk Real Estate Newsletter: First Look at 2023 Housing Forecasts
A brief excerpt:
Towards the end of each year, I collect some housing forecasts for the following year.There is much more in the article. You can subscribe at https://calculatedrisk.substack.com/
For comparison, new home sales in 2022 will probably be around 650 thousand, down from 771 thousand in 2021.
Total housing starts will be around 1.58 million in 2022, down slightly from 1.60 million in 2021.
Existing home sales will be around 5.1 million in 2022, down from 6.1 million in 2021.
As of August, Case-Shiller house prices were up 13.0% year-over-year, but the year-over-year change is slowing rapidly.
Currently the Fannie Mae forecast is an outlier with a sharper decline in total starts and home sales than the other forecasts.
These forecasts will be updated over the next couple of months, and I’ll also add several more as they become available (and my own forecasts).
HVS: Q3 2022 Homeownership and Vacancy Rates
by Calculated Risk on 11/02/2022 11:16:00 AM
The Census Bureau released the Residential Vacancies and Homeownership report for Q3 2022.
The results of this survey were significantly distorted by the pandemic in 2020.
This report is frequently mentioned by analysts and the media to track household formation, the homeownership rate, and the homeowner and rental vacancy rates. However, there are serious questions about the accuracy of this survey.
This survey might show the trend, but I wouldn't rely on the absolute numbers. Analysts probably shouldn't use the HVS to estimate the excess vacant supply or household formation, or rely on the homeownership rate, except as a guide to the trend.
National vacancy rates in the third quarter 2022 were 6.0 percent for rental housing and 0.9 percent for homeowner housing. The rental vacancy rate was not statistically different from the rate in the third quarter 2021 (5.8 percent) and 0.4 percentage points higher than the rate in the second quarter 2022 (5.6 percent).
The homeowner vacancy rate of 0.9 percent was virtually the same as the rate in the third quarter 2021 (0.9 percent) and not statistically different from the rate in the second quarter 2022 (0.8 percent).
The homeownership rate of 66.0 percent was 0.6 percentage points higher than the rate in the third quarter 2021 (65.4 percent) and not statistically different from the rate in the second quarter 2022 (65.8 percent).
emphasis added
 Click on graph for larger image.
The results in Q2 and Q3 2020 were distorted by the pandemic and should be ignored.
 The HVS homeowner vacancy increased to 0.9% in Q3 from 0.8% in Q2.
 Once again - this probably shows the general trend, but I wouldn't rely on the absolute numbers.
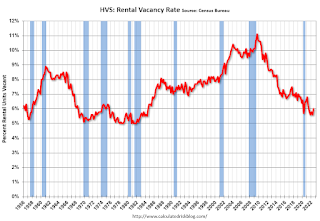 The rental vacancy rate increased to 6.0% in Q3 from 5.6% in Q2.
 The HVS also has a series on asking rents. This surged following the early stages of the pandemic - like other measures - and is up 10.9% year-over-year in Q3 2022.
The quarterly HVS is the timeliest survey on households, but there are many questions about the accuracy of this survey.
ADP: Private Employment Increased 239,000 in October
by Calculated Risk on 11/02/2022 08:26:00 AM
Private sector employment increased by 239,000 jobs in October and annual pay was up 7.7 percent year-over-year, according to the October ADP® National Employment ReportTM produced by the ADP Research Institute® in collaboration with the Stanford Digital Economy Lab (“Stanford Lab”).This was above the consensus forecast of 200,000. The BLS report will be released Friday, and the consensus is for 2o0 thousand non-farm payroll jobs added in October.
The jobs report and pay insights use ADP’s fine-grained anonymized and aggregated payroll data of over 25 million U.S. employees to provide a representative picture of the labor market. The report details the current month’s total private employment change, and weekly job data from the previous month. ADP’s pay measure uniquely captures the earnings of a cohort of almost 10 million employees over a 12-month period.
“This is a really strong number given the maturity of the economic recovery but the hiring was not broad based,” said Nela Richardson, chief economist, ADP. “Goods producers, which are sensitive to interest rates, are pulling back, and job changers are commanding smaller pay gains. While we’re seeing early signs of Fed-driven demand destruction, it’s affecting only certain sectors of the labor market.”
emphasis added
MBA: Mortgage Applications Decrease in Latest Weekly Survey
by Calculated Risk on 11/02/2022 07:00:00 AM
From the MBA: Mortgage Applications Decrease in Latest MBA Weekly Survey
Mortgage applications decreased 0.5 percent from one week earlier, according to data from the Mortgage Bankers Association’s (MBA) Weekly Mortgage Applications Survey for the week ending October 28, 2022. This week’s results include revised data to reflect an update to last week’s survey results.
... The Refinance Index increased 0.2 percent from the previous week and was 85 percent lower than the same week one year ago. The seasonally adjusted Purchase Index decreased 1 percent from one week earlier. The unadjusted Purchase Index decreased 2 percent compared with the previous week and was 41 percent lower than the same week one year ago.
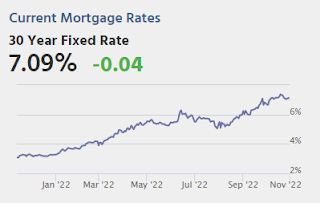
“Mortgage applications declined for the sixth consecutive week despite a slight drop in rates. The 30-year fixed rate decreased for the first time in over two months to 7.06 percent, but remained close to its highest since 2002,” said Joel Kan, MBA’s Vice President and Deputy Chief Economist. “Apart from the ARM loan rate, rates for all other loan types were more than three percentage points higher than they were a year ago. These elevated rates continue to put pressure on both purchase and refinance activity and have added to the ongoing affordability challenges impacting the broader housing market, as seen in the deteriorating trends in housing starts and home sales.”
Added Kan: “With most homeowners locked into significantly lower rates, refinance applications continued to run more than 80 percent below last year’s pace, while the refinance share of applications was 28.6 percent – the fifth straight week below 30 percent.”
...
The average contract interest rate for 30-year fixed-rate mortgages with conforming loan balances ($647,200 or less) decreased to 7.06 percent from 7.16 percent, with points decreasing to 0.73 from 0.88 (including the origination fee) for 80 percent loan-to-value ratio (LTV) loans.
emphasis added
 Click on graph for larger image.
The first graph shows the refinance index since 1990.
Note: Red is a four-week average (blue is weekly).
Tuesday, November 01, 2022
Wednesday: FOMC Announcement, ADP Employment
by Calculated Risk on 11/01/2022 09:00:00 PM
Wednesday:
• At 7:00 AM ET, The Mortgage Bankers Association (MBA) will release the results for the mortgage purchase applications index.
• At 8:15 AM, The ADP Employment Report for October. This report is for private payrolls only (no government). The consensus is for 200,000 jobs added, down from 208,000 in September.
• At 2:00 PM, FOMC Meeting Announcement. The FOMC is expected to raise rates 75bp at this meeting.
• At 2:30 PM, Fed Chair Jerome Powell holds a press briefing following the FOMC announcement.
Vehicles Sales "Surge" to 14.90 million SAAR in October
by Calculated Risk on 11/01/2022 05:58:00 PM
Wards Auto released their estimate of light vehicle sales for October. Wards Auto estimates sales of 14.90 million SAAR in October 2022 (Seasonally Adjusted Annual Rate), up 10.4% from the September sales rate, and up 12.7% from October 2021.
 Click on graph for larger image.
This graph shows light vehicle sales since 2006 from the BEA (blue) and Wards Auto's estimate for October (red).
The impact of COVID-19 was significant, and April 2020 was the worst month. After April 2020, sales increased, and were close to sales in 2019 (the year before the pandemic).
 The second graph shows light vehicle sales since the BEA started keeping data in 1967.
 How Much will the Fannie & Freddie Conforming Loan Limit Increase for 2023?
by Calculated Risk on 11/01/2022 12:34:00 PM
Today, in the Calculated Risk Real Estate Newsletter: How Much will the Fannie & Freddie Conforming Loan Limit Increase for 2023?
A brief excerpt:
The Official Limits will be released On Tuesday, November 29thThere is much more in the article. You can subscribe at https://calculatedrisk.substack.com/
...
This graph shows the CLL since 1979. Note that during periods when house prices decline, the CLL is not reduced. The CLL was at $417,000 from 2006 through 2016, and only increased slightly in 2017 as the house price index caught back up to the previous high reached during the housing bubble. ...
The adjustment is based on the House Price Index value in Q3 divided by Q3 in the prior year. The FHFA index is a repeat sales index, similar to Case-Shiller.
...
We need the house price data through September 2022 to calculate the conforming loan limit for 2023. This quarterly data will be released on November 29th. Currently we only have data for Q2 2022 for the quarterly index (up 17.0% from Q2 2021), however, the Purchase-Only index was up 11.9% through August 2022. Clearly prices have slowed sharply in Q3. Using the purchase index as a guide, and assuming a similar decline in September in the YoY price change - the CLL will increase around 12% in 2023.
Based on an estimated 12% year-over-year house price change, the CLL will be around $725,000 in 2023. For high-cost areas like Los Angeles, the limit could increase to around $1.08 million.
BLS: Job Openings Increased to 10.7 million in September
by Calculated Risk on 11/01/2022 10:29:00 AM
From the BLS: Job Openings and Labor Turnover Summary
The number of job openings increased to 10.7 million on the last business day of September, the U.S. Bureau of Labor Statistics reported today. The number of hires edged down to 6.1 million, while total separations decreased to 5.7 million. Within separations, quits (4.1 million) changed little and layoffs and discharges (1.3 million) edged down.The following graph shows job openings (black line), hires (dark blue), Layoff, Discharges and other (red column), and Quits (light blue column) from the JOLTS.
emphasis added
This series started in December 2000.
Note: The difference between JOLTS hires and separations is similar to the CES (payroll survey) net jobs headline numbers. This report is for September the employment report this Friday will be for October.
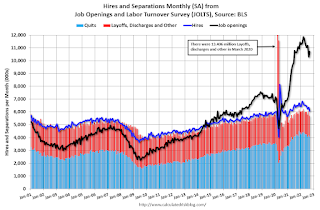 Click on graph for larger image.
Note that hires (dark blue) and total separations (red and light blue columns stacked) are usually pretty close each month. This is a measure of labor market turnover. When the blue line is above the two stacked columns, the economy is adding net jobs - when it is below the columns, the economy is losing jobs.
The spike in layoffs and discharges in March 2020 is labeled, but off the chart to better show the usual data.
Jobs openings increased in September to 10.717 million from 10.280 million in August.
The number of job openings (black) were up slightly year-over-year.
Quits were down 5% year-over-year. These are voluntary separations. (See light blue columns at bottom of graph for trend for "quits").
Construction Spending Increased 0.2% in September
by Calculated Risk on 11/01/2022 10:21:00 AM
From the Census Bureau reported that overall construction spending increased:
Construction spending during September 2022 was estimated at a seasonally adjusted annual rate of $1,811.1 billion, 0.2 percent above the revised August estimate of $1,807.0 billion. The September figure is 10.9 percent above the September 2021 estimate of $1,632.9 billion.Private spending increased and public spending decreased:
emphasis added
Spending on private construction was at a seasonally adjusted annual rate of $1,450.3 billion, 0.4 percent above the revised August estimate of $1,444.9 billion. ...
In September, the estimated seasonally adjusted annual rate of public construction spending was $360.9 billion, 0.4 percent below the revised August estimate of $362.1 billion.
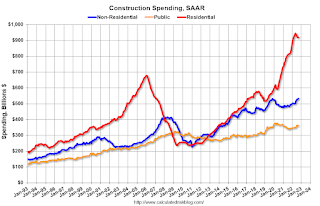 Click on graph for larger image.
This graph shows private residential and nonresidential construction spending, and public spending, since 1993. Note: nominal dollars, not inflation adjusted.
Residential (red) spending is 35% above the bubble peak (in nominal terms - not adjusted for inflation).
Non-residential (blue) spending is 28% above the bubble era peak in January 2008 (nominal dollars).
Public construction spending is 11% above the peak in March 2009.
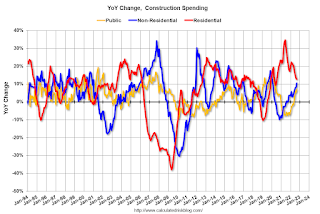 The second graph shows the year-over-year change in construction spending.
On a year-over-year basis, private residential construction spending is up 12.7%. Non-residential spending is up 10.5% year-over-year. Public spending is up 7.1% year-over-year.
ISM® Manufacturing index Declined to 50.2% in October
by Calculated Risk on 11/01/2022 10:08:00 AM
(Posted with permission). The ISM manufacturing index indicated expansion. The PMI® was at 50.2% in October, down from 50.9% in September. The employment index was at 50.0%, up from 48.7% last month, and the new orders index was at 49.2%, up from 47.1%.
From ISM: Manufacturing PMI® at 50.2% October 2022 Manufacturing ISM® Report On Business®
Economic activity in the manufacturing sector grew in October, with the overall economy achieving a 29th consecutive month of growth, say the nation's supply executives in the latest Manufacturing ISM® Report On Business®.This suggests manufacturing expanded at a slower pace in October than in September. This was slightly above the consensus forecast.
The report was issued today by Timothy R. Fiore, CPSM, C.P.M., Chair of the Institute for Supply Management® (ISM®) Manufacturing Business Survey Committee:
“The October Manufacturing PMI® registered 50.2 percent, 0.7 percentage point lower than the 50.9 percent recorded in September. This figure indicates expansion in the overall economy for the 29th month in a row after contraction in April and May 2020. The Manufacturing PMI® figure is the lowest since May 2020, when it registered 43.5 percent. The New Orders Index remained in contraction territory at 49.2 percent, 2.1 percentage points higher than the 47.1 percent recorded in September. The Production Index reading of 52.3 percent is a 1.7-percentage point increase compared to September’s figure of 50.6 percent. The Prices Index registered 46.6 percent, down 5.1 percentage points compared to the September figure of 51.7 percent. This is the index’s lowest reading since May 2020 (40.8 percent). The Backlog of Orders Index registered 45.3 percent, 5.6 percentage points lower than the September reading of 50.9 percent. After one month of contraction, the Employment Index was unchanged at 50 percent, 1.3 percentage points higher than the 48.7 percent recorded in September. The Supplier Deliveries Index reading of 46.8 percent is 5.6 percentage points lower than the September figure of 52.4 percent. This reading, the index’s lowest since March 2009 (43.2 percent), ended a streak of 79 months in ‘slowing’ territory. The Inventories Index registered 52.5 percent, 3 percentage points lower than the September reading of 55.5 percent. The New Export Orders Index reading of 46.5 percent is down 1.3 percentage points compared to September’s figure of 47.8 percent. This is the index’s lowest figure since May 2020, when it registered 39.5 percent. The Imports Index remained in expansion territory at 50.8 percent, 1.8 percentage points below the September reading of 52.6 percent.”
emphasis added
CoreLogic: House Prices up 11.4% YoY in September; Declined 0.5% MoM in September NSA
by Calculated Risk on 11/01/2022 08:00:00 AM
Notes: This CoreLogic House Price Index report is for September. The recent Case-Shiller index release was for August. The CoreLogic HPI is a three-month weighted average and is not seasonally adjusted (NSA).
From CoreLogic: CoreLogic: While Buyer Demand Cools, Home Prices Dropped by 0.5% in September From the Previous Month
CoreLogic® ... today released the CoreLogic Home Price Index (HPI™) and HPI Forecast™ for September 2022.
U.S. home price growth continued to relax on a year-over-year basis in September, posting an 11.4% increase. As in previous months, Southeastern states put up significantly higher price gains than the national growth rate, with Florida again leading the country for the eighth consecutive month. Although rising mortgage rates continue to dampen housing demand nationwide, out-migration from more expensive states on the West Coast and in the Northeast is likely fueling homebuyer enthusiasm for properties in relatively more affordable Southeastern states. CoreLogic expects annual U.S. home price growth to continue to slow over the next 12 months to 3.9% by September 2023.
“The rapid increase in prices during the COVID-19 pandemic caused many U.S. housing markets to reach completely unaffordable levels for potential local homebuyers,” said Selma Hepp, interim lead of the Office of the Chief Economist at CoreLogic. “On the West Coast and in Mountain-West states, home prices are slowing from this spring’s high but remain elevated from a year ago. By contrast, markets that continue to see an in-migration of higher-income households are still experiencing home price gains that are notably higher than the national rate of appreciation.”
...
U.S. home prices (including distressed sales) increased 11.4% year over year in September 2022 compared to September 2021. On a month-over-month basis, home prices declined by 0.5% compared to August 2022.
emphasis added
Monday, October 31, 2022
Tuesday: ISM Mfg, Construction Spending, Vehicle Sales
by Calculated Risk on 10/31/2022 08:57:00 PM
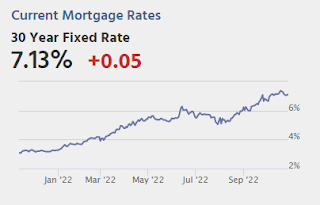
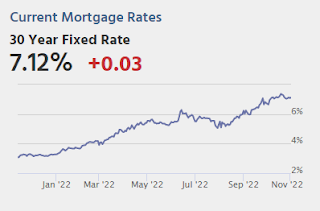
Mortgage rates are fresh off their best week since at least July and their best winning streak (in terms of consecutive days moving lower) in well over a year. The price of admission happened to be the highest rates in more than 20 years, so the recent improvements were really nothing more than a balancing act. ... [30 year fixed 7.13%]Tuesday:
emphasis added
• At 8:00 AM ET, Corelogic House Price index for September.
• At 10:00 AM, ISM Manufacturing Index for October. The consensus is for 49.9, down from 50.9.
• Also at 10:00 AM, Construction Spending for September. The consensus is for 0.5% decrease in spending.
• Late, Light vehicle sales for October. The consensus is for sales of 14.3 million SAAR, up from 13.5 million SAAR in September (Seasonally Adjusted Annual Rate).
Fannie Mae: Mortgage Serious Delinquency Rate Decreased in September
by Calculated Risk on 10/31/2022 04:47:00 PM
Fannie Mae reported that the Single-Family Serious Delinquency decreased to 0.69% in September from 0.72% in August. The serious delinquency rate is down from 1.62% in September 2021. This is close to pre-pandemic levels.
These are mortgage loans that are "three monthly payments or more past due or in foreclosure".
The Fannie Mae serious delinquency rate peaked in February 2010 at 5.59% following the housing bubble and peaked at 3.32% in August 2020 during the pandemic.
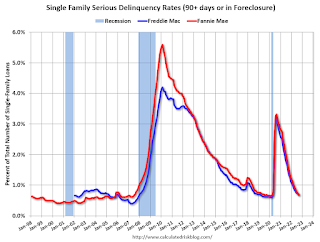
By vintage, for loans made in 2004 or earlier (1% of portfolio), 2.41% are seriously delinquent (down from 2.48% in August).
Mortgages in forbearance were counted as delinquent in this monthly report, but they were not reported to the credit bureaus.
Freddie Mac reported earlier.
Q3 2022 GDP Details on Residential and Commercial Real Estate
by Calculated Risk on 10/31/2022 02:46:00 PM
The BEA released the underlying details for the Q3 advance GDP report on Friday.
The BEA reported that investment in non-residential structures increased at a 3.7% annual pace in Q3. Investment in petroleum and natural gas structures increased in Q3 compared to Q2 and was up 22% year-over-year.

The first graph shows investment in offices, malls and lodging as a percent of GDP.
Investment in offices (blue) increased slightly in Q3 and was down 1.3% year-over-year. And still declining as a percent of GDP.
Investment in multimerchandise shopping structures (malls) peaked in 2007 and was up about 16% year-over-year in Q3 - from a very low level. The vacancy rate for malls is still very high, so investment will probably stay low for some time.
Lodging investment increased in Q3 compared to Q2, and lodging investment was up 6% year-over-year.
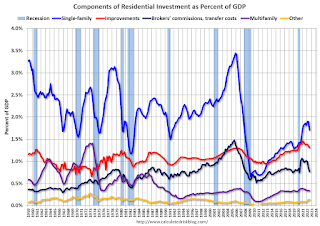 The second graph is for Residential investment components as a percent of GDP. According to the Bureau of Economic Analysis, RI includes new single-family structures, multifamily structures, home improvement, Brokers’ commissions and other ownership transfer costs, and a few minor categories (dormitories, manufactured homes).
Investment in single family structures was $438 billion (SAAR) (about 1.7% of GDP) and was unchanged year-over-year.
Investment in multi-family structures was up in Q3 from Q2.
Investment in home improvement was at a $335 billion Seasonally Adjusted Annual Rate (SAAR) in Q3 (about 1.3% of GDP). Home improvement spending was strong during the pandemic but has declined as a percent of GDP recently.
Year-over-year Pace of Rent Increases Continues to Slow
by Calculated Risk on 10/31/2022 09:52:00 AM
Today, in the Calculated Risk Real Estate Newsletter: Year-over-year Pace of Rent Increases Continues to Slow
A brief excerpt:
Here is a graph of the year-over-year (YoY) change for these measures since January 2015. All of these measures are through September 2022 (Apartment List through October 2022).There is much more in the article. You can subscribe at https://calculatedrisk.substack.com/
Note that new lease measures (Zillow, Apartment List) dipped early in the pandemic, whereas the BLS measures were steady. Then new leases took off, and the BLS measures are picking up.
...
The Zillow measure is up 10.8% YoY in September, down from 12.3% YoY in August. This is down from a peak of 17.2% YoY in February.
The ApartmentList measure is up 5.9% YoY as of October, down from 7.5% in September. This is down from the peak of 18.0% YoY last November.
Rents are still increasing YoY, and we should expect this to continue to spill over into measures of inflation. The Owners’ Equivalent Rent (OER) was up 6.7% YoY in September, from 6.3% YoY in August - and will likely increase further in the coming months even as rents slow sharply.
...
My suspicion is rent increases will slow further over the coming months as the pace of household formation slows, and more supply comes on the market. Housing economist Tom Lawler recently wrote: "An actual decline in rents next year would be a reasonable base case"
Housing October 31st Weekly Update: Inventory Increased, New High for 2022
by Calculated Risk on 10/31/2022 08:42:00 AM
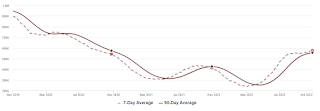 Click on graph for larger image.
This inventory graph is courtesy of Altos Research.
1. The seasonal bottom (happened on March 4, 2022, for Altos) ✅
2. Inventory up year-over-year (happened on May 20, 2022, for Altos) ✅
3. Inventory up compared to 2020 (happened on October 7, 2022, for Altos) ✅
4. Inventory up compared to 2019 (currently down 37.2%).


