by Calculated Risk on 2/01/2023 08:25:00 AM
Wednesday, February 01, 2023
ADP: Private Employment Increased 106,000 in January
Private sector employment increased by 106,000 jobs in January and annual pay was up 7.3 percent year-over-year, according to the January ADP® National Employment ReportTM produced by the ADP Research Institute® in collaboration with the Stanford Digital Economy Lab (“Stanford Lab”).This was well below the consensus forecast of 170,000, however, ADP blamed it on the weather. The BLS report will be released Friday, and the consensus is for 185 thousand non-farm payroll jobs added in January.
...
"In January, we saw the impact of weather-related disruptions on employment during our reference week,” said Nela Richardson, chief economist, ADP. “Hiring was stronger during other weeks of the month, in line with the strength we saw late last year.”
emphasis added
MBA: Mortgage Applications Decreased in Latest Weekly Survey
by Calculated Risk on 2/01/2023 07:00:00 AM
From the MBA: Mortgage Applications Decrease in Latest MBA Weekly Survey
Mortgage applications decreased 9.0 percent from one week earlier, according to data from the Mortgage Bankers Association’s (MBA) Weekly Mortgage Applications Survey for the week ending January 27, 2023.
... The Refinance Index decreased 7 percent from the previous week and was 80 percent lower than the same week one year ago. The seasonally adjusted Purchase Index decreased 10 percent from one week earlier. The unadjusted Purchase Index increased 7 percent compared with the previous week and was 41 percent lower than the same week one year ago.
“Mortgage rates declined for the fourth straight week and have now fallen almost 40 basis points over the past month. Treasury yields were higher on average last week, while mortgage rates decreased, which was a sign of a narrowing spread between the two,” said Joel Kan, MBA’s Vice President and Deputy Chief Economist. “The spread between mortgage rates and the 10-year Treasury has been abnormally wide since early 2022. Further narrowing of that spread is expected to put downward pressure on mortgage rates in the coming months. Overall application activity declined last week despite lower rates, which is an indication of the still volatile time of the year for housing activity. Purchase activity is expected to pick up as the spring homebuying season gets underway, bolstered by lower rates and moderating home-price growth. Both trends will help some buyers regain purchasing power.”
...
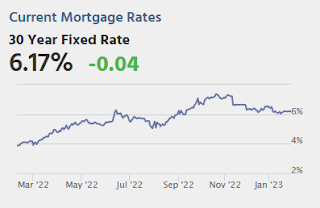
The average contract interest rate for 30-year fixed-rate mortgages with conforming loan balances ($726,200 or less) decreased to 6.19 percent from 6.20 percent, with points decreasing to 0.65 from 0.69 (including the origination fee) for 80 percent loan-to-value ratio (LTV) loans.
emphasis added
 Click on graph for larger image.
The first graph shows the refinance index since 1990.
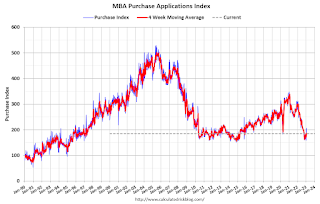 According to the MBA, purchase activity is down 41% year-over-year unadjusted. This is near housing bust levels.
Tuesday, January 31, 2023
Wednesday: FOMC Statement, Job Openings, ADP Employment, Construction Spending, ISM Mfg
by Calculated Risk on 1/31/2023 09:00:00 PM
Wednesday:
• At 7:00 AM ET, The Mortgage Bankers Association (MBA) will release the results for the mortgage purchase applications index.
• At 8:15 AM, The ADP Employment Report for January. This report is for private payrolls only (no government). The consensus is for 170,000 payroll jobs added in January, down from 235,000 added in December.
• At 10:00 AM, Construction Spending for December. The consensus is for a 0.1% decrease in construction spending.
• Also, at 10:00 AM, Job Openings and Labor Turnover Survey for December from the BLS.
• Also, at 10:00 AM, ISM Manufacturing Index for January. The consensus is for the ISM to be at 48.0, down from 48.4 in December.
• At 2:00 PM, FOMC Meeting Announcement. The FOMC is expected to announce a 25 bp hike in the Fed Funds rate.
• At 2:30 PM, Fed Chair Jerome Powell holds a press briefing following the FOMC announcement.
• Late, Light vehicle sales for January. The consensus is for light vehicle sales to be 14.3 million SAAR in January, up from 13.3 million in December (Seasonally Adjusted Annual Rate).
Las Vegas December 2022: Visitor Traffic Down 4.6% Compared to 2019; Convention Traffic Down 38.2%
by Calculated Risk on 1/31/2023 04:00:00 PM
Note: I like using Las Vegas as a measure of recovery for both leisure (visitors) and business (conventions).
From the Las Vegas Visitor Authority: December 2022 Las Vegas Visitor Statistics
From the initial shadow of the omicron variant to record‐shattering room rates later in the year, Las Vegas enjoyed a robust recovery trajectory across core tourism indicators in 2022. With December 2022 visitation just 4.6% shy of December 2019, the year closed out with 38.8M annual visitors, 20.5% ahead of 2021 and ‐8.7% under 2019's tally.
Convention attendance for the year approached 5.0M attendees, dramatically ahead of pandemic‐suppressed volumes of 2021 and recovering to about three‐quarters of 2019's tally of 6.6M convention attendees.
Overall hotel occupancy reached 79.2% for the year , +12.4 pts YoY and down ‐9.7 pts vs. 2019. For the year, Weekend occupancy reached 89.3%, +8.0 pts over 2021 and ‐5.6 pts vs. 2019, while Midweek occupancy reached 74.7%, up 14.2 pts vs. 2021 but down ‐11.6 pts vs. 2019.
Strong room rates continued throughout 2022 as annual ADR reached $171, +24.5% higher than 2021 and +28.9% ahead of 2019 while RevPAR reached approx. $135 for the year, +47.6% YoY and +14.9% over 2019.
 Click on graph for larger image.
 The first graph shows visitor traffic for 2019 (dark blue), 2020 (light blue), 2021 (yellow) and 2022 (red)
Visitor traffic was down 4.6% compared to the same month in 2019.
Note: There was almost no convention traffic from April 2020 through May 2021.
HVS: Q4 2022 Homeownership and Vacancy Rates
by Calculated Risk on 1/31/2023 01:31:00 PM
The Census Bureau released the Residential Vacancies and Homeownership report for Q4 2022.
The results of this survey were significantly distorted by the pandemic in 2020.
This report is frequently mentioned by analysts and the media to track household formation, the homeownership rate, and the homeowner and rental vacancy rates. However, there are serious questions about the accuracy of this survey.
This survey might show the trend, but I wouldn't rely on the absolute numbers. Analysts probably shouldn't use the HVS to estimate the excess vacant supply or household formation, or rely on the homeownership rate, except as a guide to the trend.
National vacancy rates in the fourth quarter 2022 were 5.8 percent for rental housing and 0.8 percent for homeowner housing. The rental vacancy rate was not statistically different from the rate in the fourth quarter 2021 (5.6 percent) and not statistically different from the rate in the third quarter 2022 (6.0 percent).
The homeowner vacancy rate of 0.8 percent was not statistically different from the rate in the fourth quarter 2021 (0.9 percent) and not statistically different from the rate in the third quarter 2022 (0.9 percent).
The homeownership rate of 65.9 percent was not statistically different from the rate in the fourth quarter 2021 (65.5 percent) and not statistically different from the rate in the third quarter 2022 (66.0 percent).
emphasis added
 Click on graph for larger image.
The results in Q2 and Q3 2020 were distorted by the pandemic and should be ignored.
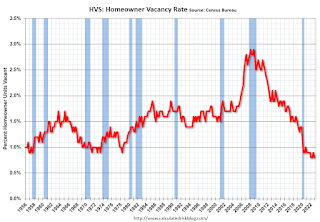 The HVS homeowner vacancy decreased to 0.8% in Q4 from 0.9% in Q3.
 Once again - this probably shows the general trend, but I wouldn't rely on the absolute numbers.
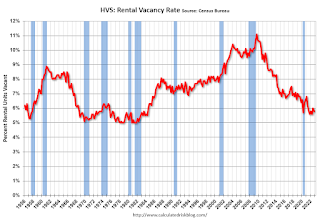 The rental vacancy rate decreased to 5.8% in Q4 from 6.0% in Q3.
 The HVS also has a series on asking rents. This surged following the early stages of the pandemic - like other measures - and is up 9.5% year-over-year in Q4 2022. This was down 0.9% in Q4 compared to Q3.
The quarterly HVS is the timeliest survey on households, but there are many questions about the accuracy of this survey.
Comments on November Case-Shiller and FHFA House Prices
by Calculated Risk on 1/31/2023 11:22:00 AM
Today, in the Calculated Risk Real Estate Newsletter: Case-Shiller: National House Price Index "Continued to Decline" to 7.7% year-over-year increase in November
Excerpt:
Both the Case-Shiller House Price Index (HPI) and the Federal Housing Finance Agency (FHFA) HPI for November were released today. Here is a graph of the month-over-month (MoM) change in the Case-Shiller National Index Seasonally Adjusted (SA).
The Case-Shiller Home Price Indices for “November” is a 3-month average of September, October and November closing prices. September closing prices include some contracts signed in July, so there is a significant lag to this data.
The MoM decrease in the Case-Shiller National Index was at -0.26% seasonally adjusted. This was the fifth consecutive MoM decrease, and a slightly larger decrease than in October.
On a seasonally adjusted basis, prices declined in 19 of the 20 Case-Shiller cities on a month-to-month basis (Detroit increased 0.1%). The largest monthly declines seasonally adjusted were in San Francisco (-1.4%), Phoenix (-1.4%) and Las Vegas (-1.2%). San Francisco has fallen 11.9% from the peak in May 2022 and is the first Case-Shiller city with a year-over-year decline (-1.6% year-over-year).
...
The November report was mostly for contracts signed in the July through October period - and was likely impacted slightly by the surge in rates in October.
The impact from higher rates in October and November will really show up in the Case-Shiller index over the next several months.
Case-Shiller: National House Price Index "Continued to Decline" to 7.7% year-over-year increase in November
by Calculated Risk on 1/31/2023 09:09:00 AM
S&P/Case-Shiller released the monthly Home Price Indices for November ("November" is a 3-month average of September, October and November closing prices).
This release includes prices for 20 individual cities, two composite indices (for 10 cities and 20 cities) and the monthly National index.
From S&P: S&P Corelogic Case-Shiller Index Continued to Decline in November
The S&P CoreLogic Case-Shiller U.S. National Home Price NSA Index, covering all nine U.S. census divisions, reported a [7.7%] annual gain in November, down from [9.3%] in the previous month. The 10- City Composite annual increase came in at [6.3%], down from [8.0%] in the previous month. The 20-City Composite posted a [6.8%] year-over-year gain, down from [8.7%] in the previous month.
[Case-Shiller had an error in their text - corrected in brackets]
Miami, Tampa, and Atlanta reported the highest year-over-year gains among the 20 cities in November. Miami led the way with a 18.4% year-over-year price increase, followed by Tampa in second with a 16.9% increase, and Atlanta in third with a 12.7% increase. All 20 cities reported lower price increases in the year ending November 2022 versus the year ending October 2022.
...
Before seasonal adjustment, the U.S. National Index posted a -0.6% month-over-month decrease in November, while the 10-City and 20-City Composites posted decreases of -0.7% and -0.8%, respectively.
After seasonal adjustment, the U.S. National Index posted a month-over-month decrease of -0.3%, and the 10-City and 20-City Composites both posted decreases of -0.5%.
In November, all 20 cities reported declines before seasonal adjustments. After seasonal adjustments, 19 cities reported declines, with only Detroit increasing 0.1%.
“November 2022 marked the fifth consecutive month of declining home prices in the U.S.,” says Craig J. Lazzara, Managing Director at S&P DJI. “For example, the National Composite Index fell -0.6% for the month, reflecting a -3.6% decline since the market peaked in June 2022. We saw comparable patterns in our 10- and 20-City Composites, both of which stand more than -5.0% below their June peaks. These declines, of course, came after very strong price increases in late 2021 and the first half of 2022. Despite its recent weakness, on a year-over-year basis the National Composite gained 7.7%, which is in the 74th percentile of historical performance levels.
“All 20 cities in our November report showed price declines on a month-over-month basis, with a median decline of -0.8%. Moreover, for all 20 cities, year-over-year gains in November were lower than those of October, with a median year-over-year increase of 6.4%. Interestingly, home prices in San Francisco were down by -1.6% year-over-year, the first negative result for any city since San Francisco’s -0.4% decline in October 2019. This is the worst year-over-year result for San Francisco in more than 10 years (since a -3.0% result in March 2012). West coast weakness was not limited to California, as San Francisco was followed by Seattle (+1.5%) and Portland (+3.9%) at the bottom of the league table.
emphasis added
 Click on graph for larger image.
 The first graph shows the nominal seasonally adjusted Composite 10, Composite 20 and National indices (the Composite 20 was started in January 2000).
The Composite 10 index is down 0.5% in November (SA) and down 4.1% from the recent peak in June 2022.
The Composite 20 index is down 0.5% (SA) in November and down 4.1% from the recent peak in June 2022.
The National index is down 0.3% (SA) in November and is down 2.5% from the peak in June 2022.
 The second graph shows the year-over-year change in all three indices.
The Composite 10 SA is up 6.3% year-over-year. The Composite 20 SA is up 6.8% year-over-year.
The National index SA is up 7.7% year-over-year.
Annual price increases were close to expectations. I'll have more later.
Monday, January 30, 2023
Tuesday: Case-Shiller House Prices
by Calculated Risk on 1/30/2023 08:47:00 PM

Unlike last week, the present example offers multiple scheduled economic reports that have consistent track records of causing market movement. Key examples include both ISM reports, ECI, JOLTS, and of course the jobs report on Friday. The Fed announcement lies smack dab in the middle on Wednesday afternoon where it is all but guaranteed that we'll see another downshift in the pace of rate hikes (25bps). [30 year fixed 6.21%]Tuesday:
emphasis added
• At 9:00 AM ET, FHFA House Price Index for November. This was originally a GSE only repeat sales, however there is also an expanded index.
• Also at 9:00 AM, S&P/Case-Shiller House Price Index for November. The consensus is for a 6.9% year-over-year increase in the Comp 20 index.
• At 9:45 AM, Chicago Purchasing Managers Index for January. The consensus is for a reading of 44.9, down from 45.1 in December.
• At 10:00 AM, The Q4 Housing Vacancies and Homeownership report from the Census Bureau.
Fannie Mae: Mortgage Serious Delinquency Rate Increased Slightly in December
by Calculated Risk on 1/30/2023 02:13:00 PM
Fannie Mae reported that the Single-Family Serious Delinquency increased to 0.65% in December from 0.64% in November. The serious delinquency rate is down from 1.25% in December 2021. This is at the pre-pandemic lows.
These are mortgage loans that are "three monthly payments or more past due or in foreclosure".
The Fannie Mae serious delinquency rate peaked in February 2010 at 5.59% following the housing bubble and peaked at 3.32% in August 2020 during the pandemic.
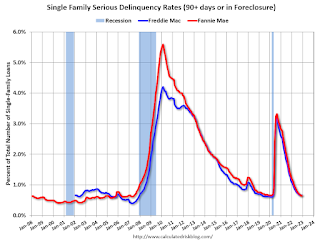
By vintage, for loans made in 2004 or earlier (1% of portfolio), 2.16% are seriously delinquent (down from 2.15% in November).
Mortgages in forbearance were counted as delinquent in this monthly report, but they were not reported to the credit bureaus.
Freddie Mac reported earlier.
Lawler: D.R. Horton (DHI) Net Order Price Declined "Roughly" 10% from Peak
by Calculated Risk on 1/30/2023 10:04:00 AM
Today, in the Calculated Risk Real Estate Newsletter: Lawler: D.R. Horton (DHI) Net Order Price Declined "Roughly" 10% from Peak
Brief excerpt:
From housing economist Tom Lawler:You can subscribe at https://calculatedrisk.substack.com/.
DHI’s average net order price last quarter was actually DOWN 4.1% from the comparable quarter of 2021, and was down 7.9% from the previous quarter. While some of this decline may have been related to the mix of sales, it’s worth noting that the average net order price was down YOY in all but one of the regions DHI reports on (the “East” saw no change, while the Southwest saw a 10% drop). In addition, the company on the conference call seemed to suggest that most of the recent price declines have reflected decreased prices and/or increased concessions (see below).
Housing January 30th Weekly Update: Inventory Decreased 1.4% Week-over-week
by Calculated Risk on 1/30/2023 08:41:00 AM
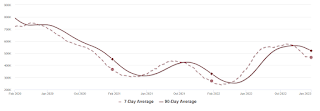 Click on graph for larger image.
This inventory graph is courtesy of Altos Research.
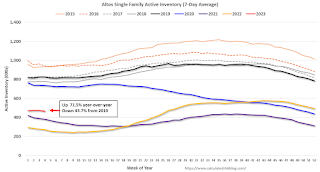
Mike Simonsen discusses this data regularly on Youtube.
Sunday, January 29, 2023
Sunday Night Futures
by Calculated Risk on 1/29/2023 06:31:00 PM
Weekend:
• Schedule for Week of January 29, 2023
Monday:
• At 10:30 AM ET, Dallas Fed Survey of Manufacturing Activity for January. This is the last of the regional Fed manufacturing surveys for January.
From CNBC: Pre-Market Data and Bloomberg futures S&P 500 futures are down 5 and DOW futures are down 46 (fair value).
Oil prices were down over the last week with WTI futures at $79.68 per barrel and Brent at $86.66 per barrel. A year ago, WTI was at $88, and Brent was at $92 - so WTI oil prices are DOWN 10% year-over-year.
Here is a graph from Gasbuddy.com for nationwide gasoline prices. Nationally prices are at $3.50 per gallon. A year ago, prices were at $3.31 per gallon, so gasoline prices are up $0.19 per gallon year-over-year.
FOMC Preview: 25bp Hike
by Calculated Risk on 1/29/2023 08:11:00 AM
Expectations are the FOMC will announce a 25bp rate increase in the federal funds rate and analysts will be looking for any mention of a possible pause in rate hikes at the March FOMC meeting.
"At the February FOMC meeting, we look for the Fed to raise the target range for the federal funds rate by 25bp to 4.50-4.75%. ... incoming data that points to a broadening of the slowdown and further signs of decelerating price pressures appear to have tipped the balance within the FOMC toward another downshift in the pace of rate hikes next week."
...
We expect Chair Powell to continue to emphasize that a slower pace of rate hikes does not signal the Fed’s job is over. ... the decision may be for a smaller 25bp hike, but the Fed will want to avoid the interpretation that this implies a lower terminal rate or an earlier onset of rate cuts than the committee viewed as appropriate when it last met in December. That means no change in policy rate guidance in the FOMC statement. We think the statement will continue to say that “ongoing increases in the target range [for the federal funds rate] will be appropriate.” A softening in this language could lead to an undesired easing in financial conditions."
emphasis added
| GDP projections of Federal Reserve Governors and Reserve Bank presidents, Change in Real GDP1 | ||||
|---|---|---|---|---|
| Projection Date | 2022 | 2023 | 2024 | 2025 |
| Dec 2022 | 0.4 to 0.5 | 0.4 to 1.0 | 1.3 to 2.0 | 1.6 to 2.0 |
The unemployment rate was at 3.5% in December. This put the Q4 rate at 3.6%, slightly lower than the FOMC projection.
| Unemployment projections of Federal Reserve Governors and Reserve Bank presidents, Unemployment Rate2 | ||||
|---|---|---|---|---|
| Projection Date | 2022 | 2023 | 2024 | 2025 |
| Dec 2022 | 3.7 | 4.4 to 4.7 | 4.3 to 4.8 | 4.0 to 4.7 |
As of December 2022, PCE inflation was up 5.0% from December 2021. On a Q4-over-Q4 basis PCE inflation was up 5.5% in Q4 2022. This was below the FOMC projection.
| Inflation projections of Federal Reserve Governors and Reserve Bank presidents, PCE Inflation1 | ||||
|---|---|---|---|---|
| Projection Date | 2022 | 2023 | 2024 | 2025 |
| Dec 2022 | 5.6 to 5.8 | 2.9 to 3.5 | 2.3 to 2.7 | 2.0 to 2.2 |
PCE core inflation was up 4.4% in December year-over-year. On a Q4-over-Q4 basis core PCE inflation was up 4.7% in Q4 2022. This was at the bottom of the FOMC projection range.
| Core Inflation projections of Federal Reserve Governors and Reserve Bank presidents, Core Inflation1 | ||||
|---|---|---|---|---|
| Projection Date | 2022 | 2023 | 2024 | 2025 |
| Dec 2022 | 4.7 to 4.8 | 3.2 to 3.7 | 2.3 to 2.7 | 2.0 to 2.2 |
Saturday, January 28, 2023
Real Estate Newsletter Articles this Week: New Home Sales at 616,000 Annual Rate in December; Previous 3 Months Revised Down Sharply
by Calculated Risk on 1/28/2023 02:11:00 PM
At the Calculated Risk Real Estate Newsletter this week:
• New Home Sales at 616,000 Annual Rate in December; Previous 3 Months Revised Down Sharply
• Final Look at Local Housing Markets in December
• 1.51 million Total Housing Completions in 2022 including Manufactured Homes; Most Since 2007
• Has Housing "Bottomed"?
This is usually published 4 to 6 times a week and provides more in-depth analysis of the housing market.
You can subscribe at https://calculatedrisk.substack.com/
Most content is available for free (and no Ads), but please subscribe!
Schedule for Week of January 29, 2023
by Calculated Risk on 1/28/2023 10:11:00 AM
The key reports scheduled for this week are the January employment report and November Case-Shiller house prices.
Other key indicators include January ISM manufacturing and services surveys, and January vehicle sales.
The FOMC meets this week, and the FOMC is expected to announce a 25 bp hike in the Fed Funds rate.
10:30 AM: Dallas Fed Survey of Manufacturing Activity for January. This is the last of the regional Fed manufacturing surveys for January.
9:00 AM: FHFA House Price Index for November. This was originally a GSE only repeat sales, however there is also an expanded index.
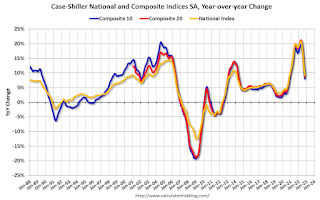 9:00 AM ET: S&P/Case-Shiller House Price Index for November.
This graph shows the Year over year change in the nominal seasonally adjusted National Index, Composite 10 and Composite 20 indexes through the most recent report (the Composite 20 was started in January 2000).
The consensus is for a 6.9% year-over-year increase in the Comp 20 index.
9:45 AM: Chicago Purchasing Managers Index for January. The consensus is for a reading of 44.9, down from 45.1 in December.
10:00 AM: The Q4 Housing Vacancies and Homeownership report from the Census Bureau.
7:00 AM ET: The Mortgage Bankers Association (MBA) will release the results for the mortgage purchase applications index.
8:15 AM: The ADP Employment Report for January. This report is for private payrolls only (no government). The consensus is for 170,000 payroll jobs added in January, down from 235,000 added in December.
10:00 AM: Construction Spending for December. The consensus is for a 0.1% decrease in construction spending.
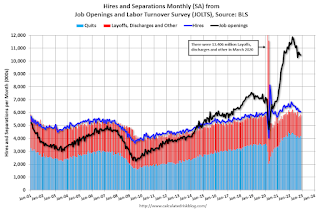 10:00 AM ET: Job Openings and Labor Turnover Survey for December from the BLS.
 This graph shows job openings (black line), hires (purple), Layoff, Discharges and other (red column), and Quits (light blue column) from the JOLTS.
Job openings decreased in November to 10.458 million from 10.512 million in October
10:00 AM: ISM Manufacturing Index for January. The consensus is for the ISM to be at 48.0, down from 48.4 in December.
2:00 PM: FOMC Meeting Announcement. The FOMC is expected to announce a 25 bp hike in the Fed Funds rate.
2:30 PM: Fed Chair Jerome Powell holds a press briefing following the FOMC announcement.
 All day: Light vehicle sales for January. The consensus is for light vehicle sales to be 14.3 million SAAR in January, up from 13.3 million in December (Seasonally Adjusted Annual Rate).
This graph shows light vehicle sales since the BEA started keeping data in 1967. The dashed line is the December sales rate.
8:30 AM: The initial weekly unemployment claims report will be released. The consensus is for 200 thousand initial claims, up from 186 thousand last week.
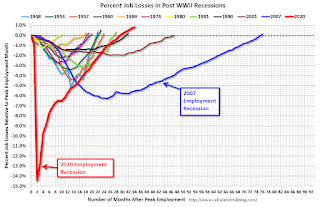 8:30 AM: Employment Report for December. The consensus is for 185,000 jobs added, and for the unemployment rate to increase to 3.6%.
There were 223,000 jobs added in December, and the unemployment rate was at 3.5%.
This graph shows the job losses from the start of the employment recession, in percentage terms.
The pandemic employment recession was by far the worst recession since WWII in percentage terms. However, as of August 2022, the total number of jobs had returned and are now 1.24 million above pre-pandemic levels.
10:00 AM: ISM Services Index for January.
Friday, January 27, 2023
COVID Jan 27, 2023: Update on Cases, Hospitalizations and Deaths
by Calculated Risk on 1/27/2023 09:58:00 PM
| COVID Metrics | ||||
|---|---|---|---|---|
| Now | Week Ago | Goal | ||
| New Cases per Week2 | 295,140 | 332,606 | ≤35,0001 | |
| Hospitalized2 | 29,411 | 34,723 | ≤3,0001 | |
| Deaths per Week2 | 3,756 | 3,948 | ≤3501 | |
| 1my goals to stop weekly posts, 2Weekly for Cases, Currently Hospitalized, and Deaths 🚩 Increasing number weekly for Cases, Hospitalized, and Deaths ✅ Goal met. | ||||
 Click on graph for larger image.
This graph shows the weekly (columns) number of deaths reported.
Hotels: Occupancy Rate Down 6.2% Compared to Same Week in 2019
by Calculated Risk on 1/27/2023 04:09:00 PM
With the Martin Luther King Jr. holiday, U.S. hotel performance came in slightly lower than the previous week, according to STR‘s latest data through Jan. 21.The following graph shows the seasonal pattern for the hotel occupancy rate using the four-week average.
Jan. 15-21, 2023 (percentage change from comparable week in 2019*):
• Occupancy: 54.2% (-6.2%)
• Average daily rate (ADR): $140.16 (+11.3%)
• evenue per available room (RevPAR): $75.97 (+4.4%)
*Due to the pandemic impact, STR is measuring recovery against comparable time periods from 2019. Year-over-year comparisons will once again become standard after Q1.
emphasis added
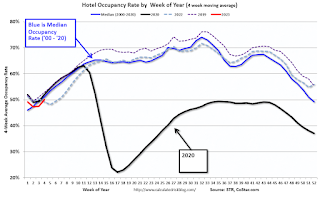 Click on graph for larger image.
The red line is for 2023, black is 2020, blue is the median, and dashed light blue is for 2022. Dashed purple is 2019 (STR is comparing to a strong year for hotels).
Realtor.com Reports Weekly Active Inventory Up 69% YoY; New Listings Down 5% YoY
by Calculated Risk on 1/27/2023 03:12:00 PM
Realtor.com has monthly and weekly data on the existing home market. Here is their weekly report released today from Chief Economist Danielle Hale: Weekly Housing Trends View — Data Week Ending Jan 21, 2023. Note: They have data on list prices, new listings and more, but this focus is on inventory.
• Active inventory growth continued to climb with for-sale homes up 69% above one year ago. In January, the housing market built further on the impressive growth seen in late 2022. But there is still room for more. Even after surging more than 50% in December 2022, the number of homes on the market trailed pre-pandemic counts by nearly 40%.
...
• New listings–a measure of sellers putting homes up for sale–were again down, this week by 5% from one year ago. This marks the twenty-ninth consecutive week of year-over-year declines in homeowners listing their homes for sale, but this week’s decline was not only smaller than dip, the average decline in new listings so far this year is about half what we saw in the fourth quarter of 2022. As mortgage rates rose and the market shifted from a distinct seller’s market to one that might better be described as a nobody’s market, we saw homeowners retrench, and the number of new listings fell. Although the number of new listings is still declining, at the current pace we could see a reversal of that trend or more new listings than one year ago as soon as February.
 Here is a graph of the year-over-year change in inventory according to realtor.com.
 In early 2022, inventory was declining rapidly, so the year-over-year change is up sharply.
Has Housing "Bottomed"?
by Calculated Risk on 1/27/2023 12:18:00 PM
Today, in the Calculated Risk Real Estate Newsletter: Has Housing "Bottomed"?
Brief excerpt:
I’ve heard some positive comments from a number of real estate agents in the last week about the existing home market.You can subscribe at https://calculatedrisk.substack.com/.
...
Activity is still down sharply year-over-year (YoY), but the YoY decline is getting smaller.
And some upbeat comments on new home sales ...
Way back in 2009, I pointed out that there are usually two bottoms for housing.There will probably be two bottoms for Residential Real Estate.The first bottom is for activity, and the second is for prices.
The first will be for new home sales, housing starts and residential investment. The second bottom will be for prices. Sometimes these bottoms can happen years apart.
NAR: Pending Home Sales Increased 2.5% in December, Year-over-year Down 33.8%
by Calculated Risk on 1/27/2023 10:03:00 AM
From the NAR: Pending Home Sales Increased 2.5% in December, Ending Six-Month Slide
Pending home sales increased in December for the first time since May 2022 — following six consecutive months of declines — according to the National Association of Realtors®. The Northeast and Midwest recorded month-over-month reductions, while the South and West posted monthly gains. All four U.S. regions saw year-over-year decreases in transactions, with the West experiencing the largest decline at 37.5%.Expectations had been for a 1.0% decline for this index. Note: Contract signings usually lead sales by about 45 to 60 days, so this would usually be for closed sales in January and February.
The Pending Home Sales Index (PHSI) — a forward-looking indicator of home sales based on contract signings — improved 2.5% to 76.9 in December. Year-over-year, pending transactions dropped by 33.8%. An index of 100 is equal to the level of contract activity in 2001.
“This recent low point in home sales activity is likely over,” said NAR Chief Economist Lawrence Yun. “Mortgage rates are the dominant factor driving home sales, and recent declines in rates are clearly helping to stabilize the market.”
...
The Northeast PHSI dropped 6.5% from last month to 64.7, a decrease of 32.5% from December 2021. The Midwest index shrank 0.3% to 77.6 in December, a decline of 30.1% from one year ago.
The South PHSI rose 6.1% to 94.1 in December, dropping 34.5% from the prior year. The West index advanced 6.4% in December to 58.6, decreasing 37.5% from December 2021.
emphasis added


