by Calculated Risk on 5/25/2023 08:39:00 PM
Thursday, May 25, 2023
Friday: Personal Income and Outlays, Durable Goods
Friday:
• At 8:30 AM ET, Personal Income and Outlays, April 2023. The consensus is for a 0.4% increase in personal income, and for a 0.4% increase in personal spending. And for the Core PCE price index to increase 0.3%. PCE prices are expected to be up 4.3% YoY, and core PCE prices up 4.6% YoY.
• Also at 8:30 AM, Durable Goods Orders for April from the Census Bureau. The consensus is for a 1.1% decrease in durable goods orders.
• At 10:00 AM, University of Michigan's Consumer sentiment index (Final for May). The consensus is for a reading of 57.7.
Realtor.com Reports Weekly Active Inventory Up 20% YoY; New Listings Down 26% YoY
by Calculated Risk on 5/25/2023 04:05:00 PM
Realtor.com has monthly and weekly data on the existing home market. Here is their weekly report from chief economist Danielle Hale: Weekly Housing Trends View — Data Week Ending May 20, 2023
• Active inventory growth slowed again, with for-sale homes up just 20% above one year ago. The number of homes for sale was higher than this time last year, but not by as much as we’ve seen in recent weeks. As we have discussed, further slowing is likely ahead. One key way that this has played out is by pushing some home shoppers to consider buying a newly built home.
...
• New listings–a measure of sellers putting homes up for sale–were down again this week, by 26% from one year ago. The number of newly listed homes has been lower than the same time the previous year for the past 46 weeks. This week tied last week’s drop. With roughly two thirds of existing homeowners holding onto a mortgage more than 2 percentage points below current mortgage rates, it’s easy to see why new listings lag behind.
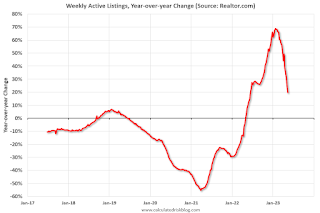 Here is a graph of the year-over-year change in inventory according to realtor.com.
 Inventory is still up year-over-year - from record lows - however, the YoY increase has slowed sharply recently.
May Vehicle Sales Forecast: 15.3 million SAAR, Up Sharply YoY
by Calculated Risk on 5/25/2023 02:02:00 PM
From WardsAuto: May U.S. Light-Vehicle Sales Set for Biggest Volume Gain in 2023 (pay content). Brief excerpt:
Rising inventory, combined with pent-up demand, is keeping growth going mostly by holding the long list of economic- and price-related headwinds at bay, but there is potential for demand to sharply drop at the end of the month – and in June - if an agreement on the U.S. debt ceiling remains elusive and further spooks consumers.Note: When writing "biggest volume gain", Wards is referring to the year-over-year gain since sales were especially weak in May 2022.
emphasis added
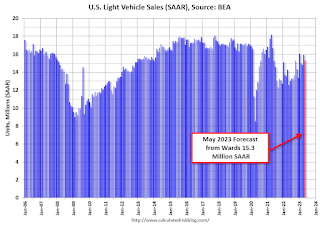 Click on graph for larger image.
This graph shows actual sales from the BEA (Blue), and Wards forecast for May (Red).
The Wards forecast of 15.3 million SAAR, would be down 3.9% from last month, and up 21.6% from a year ago.
Total Housing Completions will Likely Decrease Slightly in 2023; The Mix will Change
by Calculated Risk on 5/25/2023 10:51:00 AM
Today, in the Calculated Risk Real Estate Newsletter: Total Housing Completions will Likely Decrease Slightly in 2023; The Mix will Change
Brief excerpt:
Although housing starts have slowed, completions will likely only decrease slightly in 2023.You can subscribe at https://calculatedrisk.substack.com/.
This graph shows total housing completions and placements since 1968 with an estimate for 2023. Note that the net additional to the housing stock is less because of demolitions and destruction of older housing units.
My current estimate is total completions (single-family, multi-family, manufactured homes) will decrease in 2023 to around 1.45 million, down from 1.505 million in 2022. However, the mix will change significantly from 2022 with fewer single family completions, and more multi-family completions.
NAR: Pending Home Sales Unchanged in April; Down 20.3% Year-over-year
by Calculated Risk on 5/25/2023 10:03:00 AM
From the NAR: Pending Home Sales Recorded No Change in April
Pending home sales recorded no change in April, according to the National Association of REALTORS®. Three U.S. regions posted monthly gains, while the Northeast decreased. All four regions saw year-over-year declines in transactions.This is way below expectations of a 0.5% increase for this index. Note: Contract signings usually lead sales by about 45 to 60 days, so this would usually be for closed sales in May and June.
The Pending Home Sales Index (PHSI)* – a forward-looking indicator of home sales based on contract signings – remained at 78.9 in April, posting no change from the previous month. Year over year, pending transactions dropped by 20.3%. An index of 100 is equal to the level of contract activity in 2001.
"Not all buying interests are being completed due to limited inventory," said NAR Chief Economist Lawrence Yun. "Affordability challenges certainly remain and continue to hold back contract signings, but a sizeable increase in housing inventory will be critical to get more Americans moving."
...
The Northeast PHSI dropped 11.3% from last month to 59.1, a decrease of 21.8% from April 2022. The Midwest index improved 3.6% to 78.4 in April, down 21.4% from one year ago.
The South PHSI increased 0.1% to 99.6 in April, sinking 16.7% from the prior year. The West index augmented 4.7% in April to 62.2, sliding 26.0% from April 2022.
emphasis added
Q1 GDP Growth Revised up to 1.3% Annual Rate
by Calculated Risk on 5/25/2023 08:40:00 AM
From the BEA: Gross Domestic Product (Second Estimate), Corporate Profits (Preliminary Estimate), First Quarter 2023
Real gross domestic product (GDP) increased at an annual rate of 1.3 percent in the first quarter of 2023, according to the "second" estimate released by the Bureau of Economic Analysis. In the fourth quarter, real GDP increased 2.6 percent.Here is a Comparison of Second and Advance Estimates. PCE growth was revised up from 3.7% to 3.8%. Residential investment was revised down from -4.2% to -5.4%.
The GDP estimate released today is based on more complete source data than were available for the "advance" estimate issued last month. In the advance estimate, the increase in real GDP was 1.1 percent (refer to "Updates to GDP"). The updated estimates primarily reflected an upward revision to private inventory investment.
The increase in real GDP reflected increases in consumer spending, exports, federal government spending, state and local government spending, and nonresidential fixed investment that were partly offset by decreases in private inventory investment and residential fixed investment. Imports, which are a subtraction in the calculation of GDP, increased.
emphasis added
Weekly Initial Unemployment Claims at 229,000
by Calculated Risk on 5/25/2023 08:35:00 AM
The DOL reported:
In the week ending May 20, the advance figure for seasonally adjusted initial claims was 229,000, an increase of 4,000 from the previous week's revised level. The previous week's level was revised down by 17,000 from 242,000 to 225,000. The 4-week moving average was 231,750, unchanged from the previous week's revised average. The previous week's average was revised down by 12,500 from 244,250 to 231,750.The following graph shows the 4-week moving average of weekly claims since 1971.
emphasis added
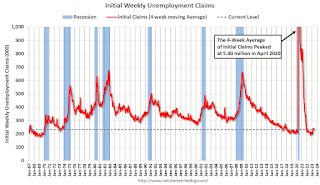 Click on graph for larger image.
The dashed line on the graph is the current 4-week average. The four-week average of weekly unemployment claims was unchanged at 231,750.
The previous week was revised down.
Weekly claims were below the consensus forecast.
Wednesday, May 24, 2023
Thursday: 2nd Estimate Q1 GDP, Unemployment Claims, Pending Home Sales
by Calculated Risk on 5/24/2023 09:01:00 PM
Thursday:
• At 8:30 AM ET, The initial weekly unemployment claims report will be released. The consensus is for 250 thousand initial claims, up from 242 thousand last week.
• Also at 8:30 AM, Gross Domestic Product, 1st quarter 2023 (Second estimate). The consensus is that real GDP increased 1.1% annualized in Q1, unchanged from the advance estimate of 1.1%.
• Also at 8:30 AM, Chicago Fed National Activity Index for April. This is a composite index of other data.
• At 10:00 AM, Pending Home Sales Index for April. The consensus is for a 0.5% increase in the index.
• At 11:00 AM, the Kansas City Fed manufacturing survey for May.
Black Knight: "Mortgage Delinquencies Rise on Calendar Effect" in April
by Calculated Risk on 5/24/2023 04:05:00 PM
From Black Knight: Black Knight’s First Look: Early-Stage Mortgage Delinquencies Rise on Calendar Effect; Prepayments Slow as Spring Homebuying Season Falters on High Rates, Low Inventory
• The national delinquency rate spiked 13% higher in April from March’s record low, with the month ending on a Sunday impacting the processing of payments made on the last calendar day of the monthAccording to Black Knight's First Look report, the percent of loans delinquent increased 13% in April compared to March and increased 2% year-over-year.
• Early-stage delinquencies (borrowers 30 days late) bore the brunt of the rise, increasing by 200K (+25%) which matches the impact of previous similar calendar-related events
• Serious delinquencies (90+ days past due) continued to improve nationally, with the number of such loans shrinking in 45 states (90%) plus the District of Columbia in April
• Foreclosure starts fell 23% to 25K for the month – the lowest since September 2022 –and 45% below April 2019’s pre-pandemic level
• Foreclosure actions were started on 4.9% of serious delinquencies in April, down slightly from March and still more than four percentage points below the monthly average prior to the pandemic
• Active foreclosure inventory declined by 6K in the month, and is down 60K or 21% from March 2020
• March saw 6,400 foreclosure sales (completions) nationally, down 14% from the month prior
• Prepayment activity (SMM) fell to 0.44% – giving back some of the previous month’s gain and suggesting the spring homebuying season is faltering on high rates and low inventory – remaining 59% off last April’s levels
emphasis added
Black Knight reported the U.S. mortgage delinquency rate (loans 30 or more days past due, but not in foreclosure) was 3.31% in April, up from 2.92% the previous month.
The percent of loans in the foreclosure process decrease in April to 0.44%, from 0.46% the previous month.
| Black Knight: Percent Loans Delinquent and in Foreclosure Process | ||||
|---|---|---|---|---|
| Apr 2023 | Mar 2023 | |||
| Delinquent | 3.31% | 2.92% | ||
| In Foreclosure | 0.44% | 0.46% | ||
| Number of properties: | ||||
| Number of properties that are delinquent, but not in foreclosure: | 1,746,000 | 1,539,000 | ||
| Number of properties in foreclosure pre-sale inventory: | 234,000 | 240,000 | ||
| Total Properties | 1,980,000 | 1,779,000 | ||
FOMC Minutes: Staff Predicts Recession Starting in Q4; Future Monetary Policy "less certain"
by Calculated Risk on 5/24/2023 02:13:00 PM
From the Fed: Minutes of the Federal Open Market Committee, May 2-3, 2023. Excerpt:
The economic forecast prepared by the staff for the May FOMC meeting continued to assume that the effects of the expected further tightening in bank credit conditions, amid already tight financial conditions, would lead to a mild recession starting later this year, followed by a moderately paced recovery. Real GDP was projected to decelerate over the next two quarters before declining modestly in both the fourth quarter of this year and the first quarter of next year. Real GDP growth over 2024 and 2025 was projected to be below the staff's estimate of potential output growth. The unemployment rate was forecast to increase this year, to peak next year, and then to start declining gradually in 2025.
...
In discussing the policy outlook, participants generally agreed that in light of the lagged effects of cumulative tightening in monetary policy and the potential effects on the economy of a further tightening in credit conditions, the extent to which additional increases in the target range may be appropriate after this meeting had become less certain. Participants agreed that it would be important to closely monitor incoming information and assess the implications for monetary policy. In determining the extent to which additional policy firming may be appropriate to return inflation to 2 percent over time, various participants noted specific factors that should bear on future decisions on policy actions. One such factor was the degree and timing with which cumulative policy tightening restrained economic activity and reduced inflation, with some participants commenting that they saw evidence that the past years' tightening was beginning to have its intended effect. Another factor was the degree to which tighter credit conditions for households and businesses resulting from events in the banking sector would weigh on activity and reduce inflation, which participants agreed was very uncertain. Additional factors included the progress toward returning inflation to the Committee's longer-run goal of 2 percent, and the pace at which labor market conditions softened and economic growth slowed.
emphasis added
AIA: Architecture Billings Decreased in April
by Calculated Risk on 5/24/2023 12:38:00 PM
Note: This index is a leading indicator primarily for new Commercial Real Estate (CRE) investment.
From the AIA: AIA/Deltek Architecture Billings Index Reflects Continued Weakness in Business Conditions in April
Architecture firms reported a modest decrease in April billings. However, there was a slight increase in inquiries into future project activity according to a report released today from The American Institute of Architects (AIA).
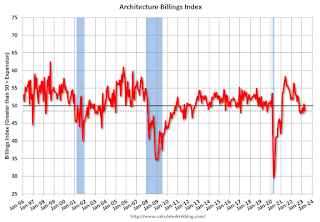
The billings score for March decreased from 50.4 in March to 48.5 in April (any score below 50 indicates a decrease in firm billings). However, firms reported that inquiries into new projects accelerated slightly to 53.9, while most firms continued to report a decline in the value of new design contracts, with a score of 49.8.
“The ongoing weakness in design activity at architecture firms reflects clients’ concerns regarding the economic outlook,” said AIA Chief Economist Kermit Baker Hon. AIA, Ph.D. “High construction costs, extended project schedules, elevated interest rates, and growing difficulty in obtaining financing are all weighing on the construction market.”
...
• Regional averages: Midwest (51.2); West (49.3); South (48.7); Northeast (47.2)
• Sector index breakdown: mixed practice (firms that do not have at least half of their billings in any one other category) (52.1); commercial/industrial (51.8); institutional (50.6); multi-family residential (41.5)
emphasis added
 Click on graph for larger image.
This graph shows the Architecture Billings Index since 1996. The index was at 48.5 in April, down from 50.4 in March. Anything below 50 indicates a decrease in demand for architects' services.
Note: This includes commercial and industrial facilities like hotels and office buildings, multi-family residential, as well as schools, hospitals and other institutions.
This index has declined in 6 of the last 7 months. This index usually leads CRE investment by 9 to 12 months, so this index suggests a slowdown in CRE investment later in 2023 and into 2024.
Two Key Housing Themes: Low Inventory and Few Distressed Sales
by Calculated Risk on 5/24/2023 09:43:00 AM
Today, in the Calculated Risk Real Estate Newsletter: Two Key Housing Themes: Low Inventory and Few Distressed Sales
Brief excerpt:
Every housing cycle is different. One of the key themes in this cycle is that existing home inventory is historically extremely low as many homeowners are “locked in” to their current home with low mortgage rates.You can subscribe at https://calculatedrisk.substack.com/.
Another key theme is that there will be few distressed sales as most homeowners have substantial equity.
Here is some data on outstanding mortgage rates and current loan-to-values.
Here is some data from the FHFA’s National Mortgage Database showing the distribution of interest rates on closed-end, fixed-rate 1-4 family mortgages outstanding at the end of each quarter since Q1 2013 through Q4 2022.
This shows the recent surge in the percent of loans under 3%, and also under 4%, starting in early 2020 as mortgage rates declined sharply during the pandemic. The percent of outstanding loans under 4% peaked in Q1 2022 at 65.4%, and the percent under 5% peaked at 85.8%. These low existing mortgage rates makes it difficult for homeowners to sell their homes and buy a new home since their monthly payments would increase sharply. This is a key reason existing home inventory levels are very low.
MBA: Mortgage Applications Decreased in Weekly Survey
by Calculated Risk on 5/24/2023 07:00:00 AM
From the MBA: Mortgage Applications Decrease in Latest MBA Weekly Survey
Mortgage applications decreased 4.6 percent from one week earlier, according to data from the Mortgage Bankers Association’s (MBA) Weekly Mortgage Applications Survey for the week ending May 19, 2023.
The Market Composite Index, a measure of mortgage loan application volume, decreased 4.6 percent on a seasonally adjusted basis from one week earlier. On an unadjusted basis, the Index decreased 5 percent compared with the previous week. The Refinance Index decreased 5 percent from the previous week and was 44 percent lower than the same week one year ago. The seasonally adjusted Purchase Index decreased 4 percent from one week earlier. The unadjusted Purchase Index decreased 5 percent compared with the previous week and was 30 percent lower than the same week one year ago.
“Mortgage applications declined almost five percent last week as borrowers remained sensitive to higher rates. The 30-year fixed rate increased to 6.69 percent, the highest level since March,” said Joel Kan, MBA’s Vice President and Deputy Chief Economist. Since rates have been so volatile and for-sale inventory still scarce, we have yet to see sustained growth in purchase applications. Refinance activity remains limited, with the refinance index falling to its lowest level in two months and more than 40 percent below last year’s pace.”
Added Kan, “Investors remained attuned to the uncertainty around the U.S. debt ceiling and communication from several Federal Reserve officials last week, which sent Treasury yields higher, along with mortgage rates. Economic data released over the past week have also pointed to a still-resilient economy. The housing market received positive data on new residential construction – which is seen as a key solution to the lack of housing inventory.”
...
The average contract interest rate for 30-year fixed-rate mortgages with conforming loan balances ($726,200 or less) increased to 6.69 percent from 6.57 percent, with points increasing to 0.66 from 0.61 (including the origination fee) for 80 percent loan-to-value ratio (LTV) loans.
emphasis added
 Click on graph for larger image.
The first graph shows the MBA mortgage purchase index.
According to the MBA, purchase activity is down 30% year-over-year unadjusted.

Tuesday, May 23, 2023
Wednesday: FOMC Minutes
by Calculated Risk on 5/23/2023 09:09:00 PM
Wednesday:
• At 7:00 AM ET, The Mortgage Bankers Association (MBA) will release the results for the mortgage purchase applications index.
• During the day: The AIA's Architecture Billings Index for April (a leading indicator for commercial real estate).
• At 2:00 PM: FOMC Minutes, Minutes Meeting of May 2-3, 2023
"Mortgage Rates Move Back Above 7%"
by Calculated Risk on 5/23/2023 05:18:00 PM
From Matthew Graham at MortgageNewsDaily: Mortgage Rates Move Back Above 7%
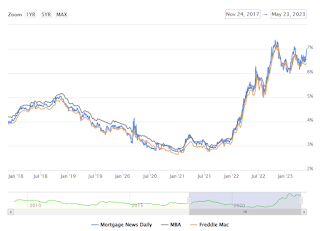
Today's headline is the most dramatic part of today's story on mortgage rates. The average top tier 30yr fixed rate has been mostly operating in a 6-7% range since September 2022. There were several weeks in the low to mid 7s in Oct/Nov and a few days in early March.
...
Rates were already quite close to 7% yesterday and today merely provided a gentle nudge. Interestingly enough, the underlying bond market currently suggests lenders would be able to drop back below 7% tomorrow, but only if current trading levels hold until then (they almost never do).
 Click on graph for larger image.
This is a graph from Mortgage News Daily (MND) showing 30-year fixed rates from three sources (MND, MBA, Freddie Mac) over the last 5 years.
New Home Sales at 683,000 Annual Rate in April; Median New Home Price is Down 15.3% from the Peak
by Calculated Risk on 5/23/2023 10:57:00 AM
Today, in the Calculated Risk Real Estate Newsletter: New Home Sales at 683,000 Annual Rate in April
Brief excerpt:
The next graph shows new home sales for 2022 and 2023 by month (Seasonally Adjusted Annual Rate). Sales in April 2023 were up 11.8% from April 2022.You can subscribe at https://calculatedrisk.substack.com/.
As expected, new home sales were up year-over-year.
...
As previously discussed, the Census Bureau overestimates sales, and underestimates inventory when cancellation rates are rising, see: New Home Sales and Cancellations: Net vs Gross Sales. This has reversed now since cancellation rates have started to decline. When a previously cancelled home is resold, the home builder counts it as a sale, but the Census Bureau does not (since it was already counted).
There are still a large number of homes under construction, and this suggests we might see a further increase in completed inventory over the next several months, but in general, this is a positive report for new home sales.
New Home Sales at 683,000 Annual Rate in April
by Calculated Risk on 5/23/2023 10:06:00 AM
The Census Bureau reports New Home Sales in April were at a seasonally adjusted annual rate (SAAR) of 683 thousand.
The previous three months were revised down, combined.
Sales of new single‐family houses in April 2023 were at a seasonally adjusted annual rate of 683,000, according to estimates released jointly today by the U.S. Census Bureau and the Department of Housing and Urban Development. This is 4.1 percent above the revised March rate of 656,000 and is 11.8 percent above the April 2022 estimate of 611,000.
emphasis added
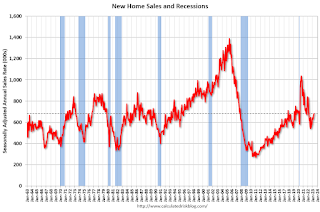 Click on graph for larger image.
The first graph shows New Home Sales vs. recessions since 1963. The dashed line is the current sales rate.
New home sales are close to pre-pandemic levels.
The second graph shows New Home Months of Supply.
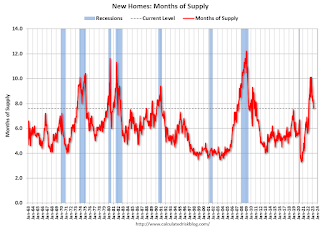 The months of supply decreased in April to 7.6 months from 7.9 months in March.
 The all-time record high was 12.2 months of supply in January 2009. The all-time record low was 3.3 months in August 2020.
This is well above the top of the normal range (about 4 to 6 months of supply is normal).
"The seasonally‐adjusted estimate of new houses for sale at the end of April was 433,000. This represents a supply of 7.6 months at the current sales rate."Sales were above expectations of 660 thousand SAAR, however, sales in the three previous months were revised down, combined. I'll have more later today.
Monday, May 22, 2023
Tuesday: New Home Sales
by Calculated Risk on 5/22/2023 08:18:00 PM

[M]ost of the past week saw the average top tier rate at 6.625% or higher for the average lender. And as of today, we're painfully close to 7.0% again. To be fair, we were already close to 7.0% on Friday. Most lenders didn't move much higher since then, and many lenders were already there. ... What's behind the spike? In general, the market is coming to terms with the possibility that the Federal Reserve may not have been that off-base over the past few months as it has maintained the need to keep rates "higher for longer." [30 year fixed 6.67%]Tuesday:
emphasis added
• At 10:00 AM ET, New Home Sales for April from the Census Bureau. The consensus is for 660 thousand SAAR, down from 683 thousand SAAR in March.
• Also at 10:00 AM, Richmond Fed Survey of Manufacturing Activity for May.
Final Look at Local Housing Markets in April
by Calculated Risk on 5/22/2023 11:56:00 AM
Today, in the Calculated Risk Real Estate Newsletter: Final Look at Local Housing Markets in April
A brief excerpt:
California Home Sales Down 36.1% YoY in April, Median Prices Decline 7.8% YoYThere is much more in the article. You can subscribe at https://calculatedrisk.substack.com/
Here is the press release from the California Association of Realtors® (C.A.R.): Higher mortgage rates and low housing inventory restrain California home sales in April, C.A.R. reports• Existing, single-family home sales totaled 267,880 in April on a seasonally adjusted annualized rate, down 4.7 percent from March and down 36.1 percent from April 2022.And a table of April sales.
• April’s statewide median home price was $815,340, up 3.0 percent from March and down 7.8 percent from April 2022. ...
In April, sales in these markets were down 26.1%. In March, these same markets were down 20.5% YoY Not Seasonally Adjusted (NSA).
This was a larger YoY decline NSA in April than in March for these markets, however there was one less selling day in April this year.
...
My early expectation is we will see a somewhat similar level of sales in May as in April. 30-year mortgage rates averaged about 6.4% in February and March (for closed sales in April), and 30-year rates averaged 6.44% in March and April (about the same).
...
More local data coming in June for activity in May!
What Happened to "Paying off the National Debt"?
by Calculated Risk on 5/22/2023 10:31:00 AM
At the turn of the millenium, the concern was that the US was paying off the debt too quickly!
Here are a few excerpts from a speech by then Fed Chair Alan Greenspan in April 2001: The paydown of federal debt
"Today I want to address a subject in which your group and the Federal Reserve share a keen interest--the paydown of the federal debt and its implications for the economy and financial markets. While the magnitudes of future federal unified budget surpluses are uncertain, they are highly likely to remain sizable for some time. ...What went wrong over the last 20+ years?
[C]urrent forecasts suggest that under a reasonably wide variety of possible tax and spending policies, the resulting surpluses will allow the Treasury debt held by the public to be paid off. Moreover, well before the debt is eliminated--indeed, possibly within a relatively few years--it may become difficult to further reduce outstanding debt to the public because the remaining obligations will mostly consist of savings bonds, well-entrenched holdings of long-term marketable debt, and perhaps other types of debt that could prove difficult to reduce."
Here is a list of events and policy choices that significantly increased the debt after 2000:
1) The 2000 projections were overly optimistic.
2) The 2001 recession.
3) The 2001 and 2003 Bush Tax Cuts.
4) 9/11, Homeland Security Spending and the War in Afghanistan
5) The War in Iraq
6) The Finacial Crisis and Great Recession
7) The Trump Tax Cuts
8) The Pandemic.
1) Overly Optimistic Projections: Here are the CBO projections from July 2000: The Budget and Economic Outlook: An Update
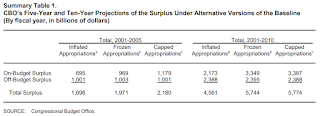 Click on graph for larger image.
The CBO projections showed an almost $6 Trillion in debt reduction in the 2001 through 2010 period.
I argued in 2000 that these projections ignored possible negative events such as an investment led recession due to the bursting of stock bubble. These projections were clearly overly optimistic.
2) The 2001 Recession: Although Greenspan mentioned "the current slowdown in economic activity" in his April 2001 speech, he didn't realize the economy was already in a recession. From the May 2000 FOMC minutes:
"The information reviewed at this meeting suggested that economic growth had remained rapid through early spring.."The economy was already in a recession!
3) Bush Tax Cuts: These tax cuts were sold as slowing the growth of the surpluses (using Greenspan's speech for cover)! Instead, the tax cuts (mostly for the wealthy) turned the surpluses into deficits and reduced revenue by $1.5 trillion or more over the 2001 - 2010 period.
 There were various Inspector General reports that the Fed and FDIC field examiners were expressing significant concerns in 2003 and 2004, but Greenspan was blocking all efforts to tighten standards - and the Bush Administratio was loosening bank regulations!
This photo shows John Reich (then Vice Chairman of the FDIC and later at the OTS) and James Gilleran of the Office of Thrift Supervision (with the chainsaw) and representatives of three banker trade associations: James McLaughlin of the American Bankers Association, Harry Doherty of America's Community Bankers, and Ken Guenther of the Independent Community Bankers of America.
“Not only will this tax plan pay for itself, but it will pay down debt,” Treasury Secretary Steve Mnuchin, Sept 2017Complete nonsense.
“I think this tax bill is going to reduce the size of our deficits going forward,” Sen. Pat Toomey (R-PA), November 2017
8) The Pandemic: Deficit spending increased sharply due to the pandemic.
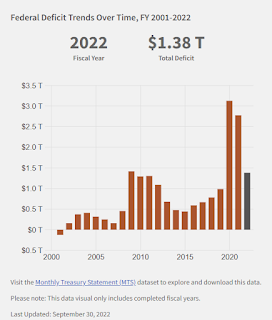 Here is a graph of the actual annual deficits since 2000.
Note: This is not adjusted for the growth of the economy. Later I'll post a graph showing the annual deficit as a percent of GDP.
So, what happened to "paying off the debt"? A series of adverse events (9/11, pandemic), and poor policy choices.
Note that all the "poor policy choices" were by Republicans including tax cuts, the Iraq War, and failure to properly regulate.
“Chutzpah is that quality enshrined in a man who, having killed his mother and father, throws himself on the mercy of the court because he is an orphan.”As far as the budget, the GOP has made a series of poor policy choices and now they want to cut the programs for the poor and middle class. Talk about Chutzpah!


