by Calculated Risk on 10/12/2009 12:17:00 PM
Monday, October 12, 2009
Hotel Industry Pulse Index Declines in September
From HotelNewsNow.com: Hotel Industry Pulse stalls
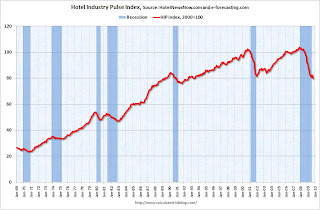
Economic research firm e-forecasting.com in conjunction with Smith Travel Research announced the HIP hit a snag in its recovery. After going up two months in a row, HIP declined 2.1 percent in September. HIP, the Hotel Industry's Pulse index, is a composite indicator that gauges business activity in the U.S. hotel industry in real-time. The latest decline brought the index to a reading of 79.7. The index was set to equal 100 in 2000.
...
“The HIP had shown improvements over the previous two months, but we’ve tried to approach those gains with cautious optimism,” said Chad Church, industry research manager at STR. “Over the past months, we saw leisure demand continue to make strides in recovery while business travel maintained its downward trend. Now that the summer travel season has come to an end, we’re waiting to see any signs of life from the business segment.”
 Click on graph for larger image in new window.
This index is now at the lowest point since 1992.
Over the last couple of years the hotel industry has been crushed. RevPAR (Revenue per available room) is off about 14% compared to the same period in 2008. And at the current occupancy and room rate levels, many hotels are losing money.
HIP historical data provided by HotelNewsNow.com and e-forecasting.com.
More from Chad Church at STR: STR's October forecast holds steady
As we come to conference season again, our outlook for 2010 and 2011 will depend heavily on the performance data we see during the next two months. ... As of now, we stand at a RevPAR projection of -4.2 percent in 2010.Chad provides this graph comparing weekend (leisure) vs. business travel:

"[D]emand in the weekend segment (which we use as a gauge for leisure travel) has stabilized, while demand in the weekday segment has yet to hit a definitive bottom. If the unemployment rate remains close to 10 percent throughout 2010, sustained demand growth in the leisure segment will be difficult. The corporate travel segment will then be the barometer for recovery, and as of August, there have been no discernable trends in our monthly data to indicate a turning point."I'll have more on Thursday, but the hotel industry is still searching for a bottom for the occupancy rate, and at the current low occupancy rates, the Average Daily Rate and RevPAR will continue to decline in 2010.
Distressed Sales: Sacramento as Example
by Calculated Risk on 10/12/2009 10:12:00 AM
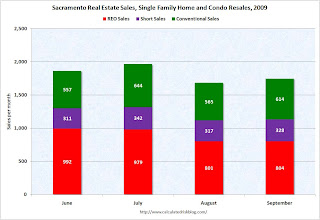
Note: The Sacramento Association of REALTORS® is now breaking out monthly resales by equity sales (conventional resales), and distressed sales (Short sales and REO sales). I'm following this series (as an example) to see changes in the mix.  Click on graph for larger image in new window.
Here is the September data.
They started breaking out REO sales last year, but this is only the fourth monthly report with short sales. About 63 percent of all resales (single family homes and condos) were distressed sales in September. The second graph shows the mix for the last four months. Conventional and short sales have held steady, but foreclosure resales were lower in August and September. There are many reports of more foreclosures coming, and the number of foreclosure resales should pick up later this year.
Total sales in September were off 18% compared to September 2008; the fourth month in a row with declining YoY sales.
On financing, over half the sales were either all cash (25.2%) or FHA loans (27.6%), suggesting most of the activity in distressed bubble areas like Sacramento is first-time home buyers using government-insured FHA loans (and taking advantage of the tax credits), and investors paying cash.
Rosenberg on Economy: "String of lowercase Ws for the next five years"
by Calculated Risk on 10/12/2009 08:43:00 AM
We are starting to exhaust the keyboard for the shape of the recovery ... and reuse letters!
Two different views:
From Bloomberg: Rosenberg Sees Low-To-No-Growth as Kantor Vows Vigorous Economy (ht jb)
“Right now the economy is being held together by very strong tape and glue provided by the Fed, Treasury and Congress,” [said David Rosenberg, Gluskin Sheff + Associates Inc.] ... The current economy won’t resemble previous V-shaped recoveries, he says. “It’s going to look like this whole string of lowercase Ws for the next five years,” with periods of growth followed by periods of contraction.And from Larry Kantor, head of research at Barclays Capital Inc. and former Fed economist:
“We think the recovery will be sustained,” ... “People talk about double-dips, the economy’s on life support and once it’s withdrawn everything is going to fall apart again. Business cycles typically don’t work that way.” ... Kantor ... says the parallel is closer to 1992, when the economy expanded 3.4 percent coming out of recession, or 1983, when it grew 4.5 percent.Of course Rosenberg tends to be bearish, and I can't remember when Kantor wasn't bullish. He was worried about inflation in 2005 and bullish in June 2008.
But this does show the range of forecasts. My view is the recovery will be sluggish for some time.
Sunday, October 11, 2009
Foreclosures Movin' on Up or Euphoria Express?
by Calculated Risk on 10/11/2009 10:37:00 PM
Kind of a weird juxtaposition ...
From the WSJ: Foreclosures Grow in Housing Market's Top Tiers
About 30% of foreclosures in June involved homes in the top third of local housing values, up from 16% when the foreclosure crisis began three years ago, according to new data from real-estate Web site Zillow.com.Meanwhile Jim the Realtor rides the Euphoria Express (mostly at the high end):
More on When the Fed might Raise Rates
by Calculated Risk on 10/11/2009 04:45:00 PM
From Paul Krugman: When should the Fed raise rates? (even more wonkish)
Let me start with a rounded version of the Rudebusch version of the Taylor rule:This is all back-of-the-envelope stuff - and maybe NAIRU or core inflation will be a little higher (although I think core inflation might be lower next year because of declining owners' equivalent rent).
Fed funds target = 2 + 1.5 x inflation - 2 x excess unemployment
where inflation is measured by the change in the core PCE deflator over the past four quarters (currently 1.6), and excess unemployment is the different between the CBO estimate of the NAIRU (currently 4.8) and the actual unemployment rate (currently 9.8).
Right now, this rule says that the Fed funds rate should be -5.6%. So we’re hard up against the zero bound.
Suppose that core inflation stays at 1.6% (although in fact it’s almost sure to go lower.) Then we can back out the unemployment rate at which the target would cross zero, suggesting that tightening should begin: it’s an excess unemployment rate of 2.2, implying an actual rate of 7 percent. That’s a long way from here. ...
If we use Krugman's analysis, and the recent CBO projections for the average annual unemployment rate (10.2% in 2010, 9.1% in 2011, and 7.2% in 2012), the Fed would not raise rates until some time in 2012.
Last month I wrote:
 Click on graph for larger image in new window.
This graph shows the effective Fed Funds rate (Source: Federal Reserve) and the unemployment rate (source: BLS)Maybe 2011. Or maybe 2012. But talk of a rate hike in early 2010 seems crazy ...
In the early '90s, the Fed waited more than a 1 1/2 years after the unemployment rate peaked before raising rates. The unemployment rate had fallen from 7.8% to 6.6% before the Fed raised rates.
Following the peak unemployment rate in 2003 of 6.3%, the Fed waited a year to raise rates. The unemployment rate had fallen to 5.6% in June 2004 before the Fed raised rates.
Although there are other considerations, since the unemployment rate will probably continue to increase into 2010, I don't expect the Fed to raise rates until late in 2010 at the earliest - and more likely sometime in 2011.


