by Calculated Risk on 10/23/2009 01:48:00 PM
Friday, October 23, 2009
Existing Home Sales: More Activity, Little Achievement
Coach John Wooden
Normally a decline in inventory and the months-of-supply would be considered a positive for the existing home market, however much of the apparent recent improvement is related to an artificial - and likely short lived - boost in activity.
The following graph is a turnover ratio for existing home sales. This is annual sales and year end inventory divided by the total number of owner occupied units. For 2009, sales are estimated at 5.0 million units, and inventory at the September level.
 Click on graph for larger image in new window.
Although the turnover ratio has fallen from the bubble years, the level is still above the median for the last 40 years. This suggests activity in 2009 is slightly above a normal year for existing homes.
The reason turnover hasn't fallen further is because of all the distressed sales (foreclosures and short sales) primarily in the low priced areas, and because of the "first-time" home buyer tax credit.
The distressed sales activity is a necessary step towards a healthy market, but the burst in activity associated with the "first-time" home buyer tax credit is "mistaking activity for achievement".
NAR chief economist Lawrence Yun argued this morning: "[W]e need a steady supply of qualified buyers to meaningfully bring inventories down ..."
Mr. Yun is making two obvious mistakes. First he is narrowly defining "inventories" as just inventories of existing homes. The total housing inventory includes existing homes, new homes, and rental properties.
If we think of a balloon that contains existing home inventory and vacant apartment units, the tax credit is like pushing a finger on the balloon - the indent makes the balloon look smaller, but the volume of the balloon remains the same (the decline in existing home inventory is offset by an increase in vacant apartments).
Note: there is some reduction in overall inventory as new households are formed, but not from incentivizing renters to become owners.
The higher rental vacancy rate is leading to lower rents, so the buy-or-rent decision will favor renting once Congress removes their finger from the balloon.
Yun also appears to be suggesting that the first-time home buyer tax credit is providing a "supply of qualified buyers". This is bubble type thinking. Did all the exotic loans during the housing bubble provide a "supply of qualified buyers"? Those buyers qualified for the loans, but they were not really ready for homeownership.
The same is true for buyers today obtaining FHA insured loans and using the $8,000 tax credit as their downpayment. Imagine a $200,000 purchase with no money down (except the tax credit). What happens in three or four years when the homeowner wants to sell? The transaction costs will be around $15,000 (about 7.5%) if they sell for the same price.
So a homeowner, who has been unable to save a down payment so far, will be expected to make a $15,000 down payment in arrears? I don't think so.
Oh wait. Haven't prices fallen significantly? Shouldn't prices just go up from here? Yun says we are returning "to a period of normal, steady price growth". So the homeowner can use their appreciation to pay the transaction costs? That is more bubble type thinking. Prices may go up. Prices may fall further. Loans should not be predicated on asset prices increasing.
“The next mistake will be a new way to make a loan that will not be repaid.”
William Seidman, "Full Faith and Credit", 1993.
Allowing buyers to use the first-time home buyer tax credit as a downpayment is "the next mistake".
Earlier post: Existing Home Sales Increase in September
Freddie Mac: Delinquency Rate Rises to 3.33 Percent
by Calculated Risk on 10/23/2009 11:59:00 AM
NOTE: I'll have some more thoughts on existing home sales soon. Click on graph for large image.
This graph shows the Freddie Mac single family delinquency rate since January 2005.
Here is the Freddie Mac portfolio data.
From Reuters: Freddie Mac Sept portfolio up, delinquencies jump (ht Ron at WallStreetPit)
Delinquencies ... jumped to 3.33 percent of its book of business in September from 3.13 percent in August and 1.22 percent in September 2008.
The multifamily delinquency rate accelerated slightly in September to 0.11 percent from 0.10 percent in August. A year earlier it was 0.01 percent..
Philly Fed State Coincident Indicators Show Widespread Weakness in September
by Calculated Risk on 10/23/2009 11:00:00 AM
Click on map for larger image.
Here is a map of the three month change in the Philly Fed state coincident indicators. Forty one states are showing declining three month activity. The index increased in 7 states, and was unchanged in 2.
Here is the Philadelphia Fed state coincident index release for September.
In the past month, the indexes increased in nine states (Idaho, Indiana, Louisiana, Montana, North Dakota, Ohio, South Dakota, Tennessee, and Vermont), decreased in 39, and remained unchanged in two (North Carolina and Nebraska) for a one-month diffusion index of -60. Over the past three months, the indexes increased in seven states (Indiana, Montana, North Dakota, Ohio, South Dakota, Tennessee, and Vermont), decreased in 41, and remained unchanged in two (Nebraska and South Carolina) for a three-month diffusion index of -68.
 The second graph is of the monthly Philly Fed data of the number of states with one month increasing activity. Most of the U.S. was has been in recession since December 2007 based on this indicator.
Note: this graph includes states with minor increases (the Philly Fed lists as unchanged).
A large percentage of states still showed declining activity in September.
Existing Home Sales Increase in September
by Calculated Risk on 10/23/2009 10:00:00 AM
The NAR reports: Big Rebound in Existing-Home Sales Shows First-Time Buyer Momentum
Existing-home sales – including single-family, townhomes, condominiums and co-ops – jumped 9.4 percent to a seasonally adjusted annual rate of 5.57 million units in September from a level of 5.10 million in August, and are 9.2 percent higher than the 5.10 million-unit pace in September 2008.
...
Total housing inventory at the end of September fell 7.5 percent to 3.63 million existing homes available for sale, which represents an 7.8-month supply2 at the current sales pace, down from an 9.3-month supply in August.
 Click on graph for larger image in new window.
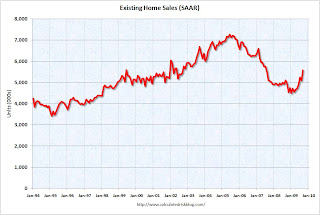
The first graph shows existing home sales, on a Seasonally Adjusted Annual Rate (SAAR) basis since 1993.
Sales in Sept 2009 (5.57 million SAAR) were 9.4% higher than last month, and were 9.2% higher than Sept 2008 (5.1 million SAAR).
Here is another way to look at existing homes sales: Monthly, Not Seasonally Adjusted (NSA):
 This graph shows NSA monthly existing home sales for 2005 through 2009. For the fourth consecutive month, sales were higher in 2009 than in 2008.
 It's important to note that many of these transactions are either investors or first-time homebuyers. Also many of the sales are distressed sales (short sales or REOs).
Early information from a large annual consumer study to be released November 13, the 2009 National Association of Realtors® Profile of Home Buyers and Sellers, shows that first-time home buyers accounted for more than 45 percent of home sales during the past year. A separate practitioner survey shows that distressed homes accounted for 29 percent of transactions in September.
 The third graph shows nationwide inventory for existing homes. According to the NAR, inventory decreased to 3.63 million in September (August inventory was revised upwards significantly). The all time record was 4.57 million homes for sale in July 2008. This is not seasonally adjusted.
Typically inventory peaks in July or August, so some of this decline is seasonal.
 The fourth graph shows the 'months of supply' metric for the last six years.
Months of supply was decline to 7.8 months.
Sales increased, and inventory decreased, so "months of supply" declined. A normal market has under 6 months of supply, so this is still high.
It is important to note that sales in September were distorted by the first time home buyer tax credit, and this activity will fade - whether or not the credit is extended.
U.K.: Recession Not Over
by Calculated Risk on 10/23/2009 08:30:00 AM
From Bloomberg: U.K. Economy Unexpectedly Shrinks in Longest Slump
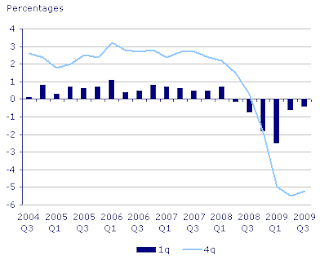
GDP fell 0.4 percent from the previous three months, the Office for National Statistics said today in London. ... The economy has now shrunk over six quarters, the most since records began in 1955.
...
“The fact that the economy is still contracting despite the huge amount of policy stimulus supports our view that the recovery will be a long, slow process,” said Vicky Redwood, U.K. economist at Capital Economics Ltd in London and a former central bank official.
...
“This is desperately disappointing news, especially given that it was hoped that a modest recovery had begun,” said John Philpott, chief economist at the Chartered Institute of Personnel and Development. “The U.K. economy is continuing to shrink, with six quarters of contraction in output making this recession look more like a depression.”
 This graph is from the Office for National Statistics: UK output decreases by 0.4 per cent
This is the sixth straight quarter of contraction.
Note that the U.K. reports GDP change per quarter, whereas the U.S. reports the annual rate of change. The 0.4% decline reported in the U.K. would be similar to a 1.6% decline reported in the U.S.


