by Calculated Risk on 8/11/2011 08:30:00 AM
Thursday, August 11, 2011
Weekly Initial Unemployment Claims decline to 395,000
The DOL reports:
In the week ending August 6, the advance figure for seasonally adjusted initial claims was 395,000, a decrease of 7,000 from the previous week's revised figure of 402,000. The 4-week moving average was 405,000, a decrease of 3,250 from the previous week's revised average of 408,250.The following graph shows the 4-week moving average of weekly claims since January 2000 (longer term graph in graph gallery).
 Click on graph for larger image in graph gallery.
The dashed line on the graph is the current 4-week average. The four-week average of weekly unemployment claims decreased this week to 405,000.
The 4-week average is still elevated, but has been moving down since mid-May. This is the lowest level for the 4-week average since early April and the first week under 400,000 since April 2nd.
Wednesday, August 10, 2011
Misc: France, Futures and More
by Calculated Risk on 8/10/2011 11:22:00 PM
• From Nelson Schwartz at the NY Times: Financial Turmoil Evokes Comparison to 2008 Crisis
Many Americans are wondering whether they are in for a repeat of the financial crisis of 2008.The European financial crisis remains a big unknown now, but I think investors are mostly concerned with lower U.S. and global growth prospects.
The answer is a matter of fierce debate ...
• And on Europe, here is a resource for Sovereign Credit-Default Swaps (ht Steve).
• The concern today was that France might lose its AAA rating and that would impact the European bailout fund, the EFSF. From the WSJ: France Considers Further Austerity
French government pledged Wednesday to consider fresh tax rises, spending cuts and other budget measures ... French bank shares were hammered Wednesday also, with some traders citing the triple-A jitters. Shares in Société Générale were down over 18% in afternoon Paris trading and BNP Paribas shares slid over 10%.• Here is a graph of the 10 year spread (Italy to Germany) from Bloomberg (currently 290). And for Spain to Germany (284).
• The Asian markets are mixed tonight with the Nikkei down 1.3%. The Shanghai is up 1%.
• U.S. Futures from CNBC: Pre-Market Data and Bloomberg futures: the S&P 500 is up about 17 points, and Dow futures are up about 150 points.
• Oil: WTI futures are up to $82 per barrel and Brent is up to $106.
FHFA, Treasury, HUD Seek Input on Disposition of REOs
by Calculated Risk on 8/10/2011 07:53:00 PM
From FHFA: FHFA, Treasury, HUD Seek Input on Disposition of Real Estate Owned Properties
The Federal Housing Finance Agency (FHFA), in consultation with the U.S. Department of the Treasury and Department of Housing and Urban Development (HUD), has announced a Request For Information (RFI), seeking input on new options for selling single-family real estate owned (REO) properties held by Fannie Mae and Freddie Mac (the Enterprises), and the Federal Housing Administration (FHA).Let me repeat the graphs I posted on Monday:
The RFI’s objective is to help address current and future REO inventory. It will explore alternatives for maximizing value to taxpayers and increasing private investment in the housing market, including approaches that support rental and affordable housing needs.
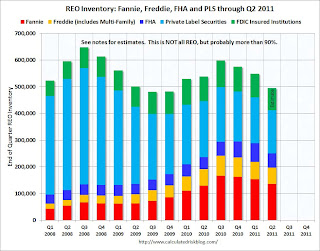
The combined REO (Real Estate Owned) inventory for Fannie, Freddie and the FHA decreased to 250,982 at the end of Q2 from a record 288,341 units at the end of Q1. The "F's" REO inventory increased 6% compared to Q2 2010 (year-over-year comparison).
 Click on graph for larger image in new window.
This graph shows the REO inventory for Fannie, Freddie and FHA through Q2 2011.
The REO inventory for the "Fs" increased sharply in 2010, but may have peaked in Q4 2010. However there may be a new peak when the foreclosure dam breaks.
The second graph shows REO inventory for Fannie, Freddie, FHA, Private Label Securities (PLS), and FDIC insured institutions. (economist Tom Lawler has provided some of this data).
 Total REO decreased to 495,000 in Q2 from almost 550,000 in Q1.
As Tom Lawler noted: "This is NOT an estimate of total residential REO, as it excludes non-FHA government REO (VA, USDA, etc.), credit unions, finance companies, non-FDIC-insured banks and thrifts, and a few other lender categories." However this is the bulk of the REO - probably 90% or more. Rounding up the estimate (using 90%) suggests total REO is around 550,000 in Q2.
But this is only the current REO, there are also a large number of properties in the "90 days delinquent" and "in foreclosure" buckets. Here is a graph I posted on Sunday:
 This graph shows the delinquent and REO buckets over time. The delinquency data is from LPS, and the REO estimates are based on work by Tom Lawler and my own calculations.
The dashed lines are "normal" historical levels for each bucket. The 30 day bucket is only slightly elevated (as of June), and the 60 day buckets is somewhat elevated. But the glaring problems are in the 90 day and in-foreclosure buckets.
There are 4.1 million seriously delinquent loans (90 day and in-foreclosure). This is about 3 million more properties than normal.
Nick Timiraos at the WSJ noted:
Together with the Federal Housing Administration, the entities owned about 250,000 homes at the end of June, or around half of all unsold, repossessed properties. Another 830,000 homes backed by the entities are in some stage of foreclosure, according to Barclays Capital.Of those 2.1 million in the foreclosure process, less than half are related to the F's.
I'll try to add some proposal ideas soon.
Dow Down 500+, S&P 500 down 4.4%
by Calculated Risk on 8/10/2011 04:14:00 PM
This was the third big down day this month ...
From the WSJ: Stocks Slide 4.6%, Erasing Tuesday Gains
The Dow Jones Industrial Average fell 520.29 points, or 4.6%, to 10719.48, while the Standard & Poor's 500-stock index slid 51.83 points, or 4.4%, to 1120.70 and the Nasdaq Composite lost 101.47 points, or 4.1%, to 2381.05.The table below shows the largest down days on the S&P 500 since 1950.
... In a reflection of investor concern, the CBOE Market Volatility Index, the "fear gauge" known as the VIX, surged 18%
| Largest S&P 500 One Day Percentage Declines since 1950 | ||||||
|---|---|---|---|---|---|---|
| Date | Percent Decline | Close | Previous Close | Six Months Later | ||
| 1 | 10/19/1987 | -20.5% | 224.84 | 282.7 | 15.3% | |
| 2 | 10/15/2008 | -9.0% | 907.84 | 998.01 | -4.7% | |
| 3 | 12/1/2008 | -8.9% | 816.21 | 896.24 | 15.7% | |
| 4 | 9/29/2008 | -8.8% | 1106.42 | 1213.27 | -28.8% | |
| 5 | 10/26/1987 | -8.3% | 227.67 | 248.22 | 15.3% | |
| 6 | 10/9/2008 | -7.6% | 909.92 | 984.94 | -5.9% | |
| 7 | 10/27/1997 | -6.9% | 876.99 | 941.64 | 23.7% | |
| 8 | 8/31/1998 | -6.8% | 957.28 | 1027.14 | 28.0% | |
| 9 | 1/8/1988 | -6.8% | 243.4 | 261.07 | 11.7% | |
| 10 | 11/20/2008 | -6.7% | 752.44 | 806.58 | 17.9% | |
| 11 | 5/28/1962 | -6.7% | 55.5 | 59.47 | 10.6% | |
| 12 | 8/8/2011 | -6.7% | 1,119.47 | 1199.38 | --- | |
| 13 | 9/26/1955 | -6.6% | 42.61 | 45.63 | 14.1% | |
| 14 | 10/13/1989 | -6.1% | 333.65 | 355.39 | 3.2% | |
| 15 | 11/19/2008 | -6.1% | 806.58 | 859.12 | 10.1% | |
| 16 | 10/22/2008 | -6.1% | 896.78 | 955.05 | -5.0% | |
| 17 | 4/14/2000 | -5.8% | 1356.56 | 1440.51 | -2.0% | |
| 18 | 10/7/2008 | -5.7% | 996.23 | 1056.89 | -18.1% | |
| 19 | 6/26/1950 | -5.4% | 18.11 | 19.14 | 10.0% | |
| 20 | 1/20/2009 | -5.3% | 805.22 | 850.12 | 18.1% | |
| 21 | 11/5/2008 | -5.3% | 952.77 | 1005.75 | -4.8% | |
| 22 | 11/12/2008 | -5.2% | 852.3 | 898.95 | 4.8% | |
| 23 | 10/16/1987 | -5.2% | 282.7 | 298.08 | -8.1% | |
| 24 | 11/6/2008 | -5.0% | 904.88 | 952.77 | 2.7% | |
| 25 | 9/17/2001 | -4.9% | 1038.77 | 1092.54 | 12.2% | |
| 26 | 2/10/2009 | -4.9% | 827.16 | 869.89 | 21.8% | |
| 27 | 9/11/1986 | -4.8% | 235.18 | 247.06 | 23.4% | |
| 28 | 8/4/2011 | -4.8% | 1200.07 | 1260.34 | --- | |
| 29 | 9/17/2008 | -4.7% | 1156.39 | 1213.6 | -31.3% | |
| 30 | 9/15/2008 | -4.7% | 1192.7 | 1251.7 | -36.8% | |
| 31 | 3/2/2009 | -4.7% | 700.82 | 735.09 | 47.1% | |
| 32 | 2/17/2009 | -4.6% | 789.17 | 826.84 | 27.2% | |
| 33 | 8/10/2011 | -4.4% | 1,120.75 | 1172.53 | --- | |
| 34 | 4/14/1988 | -4.4% | 259.75 | 271.58 | 7.0% | |
| 35 | 3/12/2001 | -4.3% | 1180.16 | 1233.42 | -8.0% | |
| 36 | 4/20/2009 | -4.3% | 832.39 | 869.6 | 31.7% | |
| 37 | 3/5/2009 | -4.3% | 682.55 | 712.87 | 46.2% | |
| 38 | 11/30/1987 | -4.2% | 230.3 | 240.34 | 10.0% | |
| 39 | 11/14/2008 | -4.2% | 873.29 | 911.29 | 4.2% | |
| 40 | 9/3/2002 | -4.2% | 878.02 | 916.07 | -6.4% | |
| 41 | 10/2/2008 | -4.0% | 1114.28 | 1161.06 | -25.1% | |
| 42 | 10/25/1982 | -4.0% | 133.32 | 138.83 | 20.3% | |
HousingTracker: Homes For Sale inventory down 13.3% Year-over-year in mid-August
by Calculated Risk on 8/10/2011 03:39:00 PM
Back in June, Tom Lawler posted on how the NAR estimates existing home inventory. The NAR does NOT aggregate data from the local boards (see Tom's post for how the NAR estimates inventory). Sometime this fall, the NAR is expected to revise down their estimates of inventory and sales for the last few years.
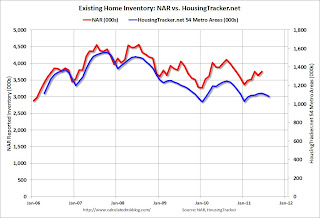
While we wait for the NAR revisions, I think the HousingTracker data that Tom mentioned might be a better estimate of changes in inventory (and always more timely). Ben at HousingTracker.net is tracking the aggregate monthly inventory for 54 metro areas.
 Click on graph for larger image in graph gallery.
This graph shows the NAR estimate of existing home inventory through June (left axis) and the HousingTracker data for the 54 metro areas through mid-August. The HousingTracker data shows a steeper decline (as mentioned above, the NAR will probably revise down their inventory estimates this summer).
 The second graph shows the year-over-year change in inventory for both the NAR and HousingTracker.
HousingTracker reported that the mid-August listings - for the 54 metro areas - declined 13.3% from last year.
Of course there is a large percentage of distressed inventory, many seriously delinquent loans and various categories of "shadow inventory" too. But the decline in listed inventory is something to watch carefully.


