by Calculated Risk on 8/15/2011 03:14:00 PM
Monday, August 15, 2011
DataQuick on SoCal: Lowest July Home Sales in Four Years
From DataQuick: Southland Housing Market's Vital Signs Remain Weak
Southern California home sales fell last month to the lowest level for a July in four years ... A total of 18,090 new and resale houses and condos sold in Los Angeles, Riverside, San Diego, Ventura, San Bernardino and Orange counties in July. That was down 11.9 percent from 20,532 in June and down 4.5 percent from 18,946 in July 2010, according to San Diego-based DataQuick.About half the sales in SoCal are distressed (foreclosure resales or short sales) and about 24% of sales were to absentee homeowners (mostly investors).
...
"The latest sales figures look a bit worse than they really are, given this July was a fairly short month, but they still suggest some potential homebuyers got spooked. Reports on the economy became increasingly downbeat and, no doubt, some people fretted over the possibility the country would default on its obligations," said John Walsh, DataQuick president.
"If there's a shred of good news in the data it's that last month's sales weren't much worse than a year earlier. For the first time in many months, we get an apples-to-apples comparison to year-ago sales, given that in July 2010 the market lost its crutch -- federal homebuyer tax credits."
...
Overall home sales in July fell across all price categories compared with June. Sales declined 11.2 percent from June for homes priced below $200,000, while they fell 13.3 percent month-to-month for $300,000-to-$800,000 homes and fell 20.5 percent for homes over $800,000.
...
Foreclosure resales -- properties foreclosed on in the prior 12 months -- made up 32.5 percent of the Southland resale market in July ... Short sales, where the sale price fell short of what was owed on the property, made up an estimated 17.3 percent of Southland resales last month.
The NAR reports existing home sales for July on Thursday.
NY Fed Q2 Report on Household Debt and Credit
by Calculated Risk on 8/15/2011 12:15:00 PM
This report shows some minor household credit improvement, but that the pace of deleveraging has slowed.
From the NY Fed: New York Fed’s Quarterly Report on Household Debt and Credit Shows Continued Signs of Healing in Consumer Credit Markets
The Federal Reserve Bank of New York today released its Household Debt and Credit Report for the second quarter of 2011. Consistent with last quarter's findings, the report shows continued signs of healing in the consumer credit markets.Here is the Q2 report: Quarterly Report on Household Debt and Credit. Here are two graphs:
...
"Outstanding consumer debt remained essentially flat, down just $50 billion, in what was basically a repeat of the previous quarter. This is more evidence that the pace of consumer deleveraging that began in late 2008 has slowed," said Andrew Haughwout, vice president in the Research and Statistics Group at the New York Fed. "During the next few quarters we will gain a better understanding of whether this is a permanent or temporary break in the decline of total outstanding consumer debt."
 Click on graph for larger image in new window.
The first graph shows aggregate consumer debt decreased slightly in Q2. From the NY Fed:
As of June 30, 2011, total consumer indebtedness was $11.4 trillion, a reduction of $1.08 trillion (8.6%) from its peak level at the close of 2008Q3, and $50 billion (0.4%) below its March 31, 2011 level. Mortgage
balances shown on consumer credit reports fell very slightly ($20 billion or 0.2%) during the quarter; home equity lines of credit (HELOC) balances fell by $20 billion (3.0%). ... Consumer indebtedness excluding mortgage and HELOC balances fell very slightly ($10 billion or about 0.4%) in the quarter.
 The second graph shows the percent of debt in delinquency. The percent of delinquent debt is declining, but what really stands out is the percent of debt 90+ days delinquent (Yellow, orange and red).
 From the NY Fed:
Total household delinquency rates declined for the sixth consecutive quarter in 2011Q2. As of June 30, 9.9% of outstanding debt was in some stage of delinquency, compared to 10.5% on March 31 and 11.4% a year ago. About $1.1 trillion of consumer debt is currently delinquent, with $833 billion seriously delinquent (at least 90 days late or “severely derogatory”). Compared to a year ago, both delinquent and seriously delinquent balances have fallen 15%.There are a number of credit graphs at the NY Fed site.
NAHB Builder Confidence index unchanged in August, Still Depressed
by Calculated Risk on 8/15/2011 10:00:00 AM
The National Association of Home Builders (NAHB) reports the housing market index (HMI) was unchanged in August at 15, the same level as in July. Any number under 50 indicates that more builders view sales conditions as poor than good.
From the NAHB: Builder Confidence Unchanged in August
Builder confidence in the market for newly built, single-family homes held unchanged at a low level of 15 on the National Association of Home Builders/Wells Fargo Housing Market Index (HMI) for August, released today.
...
"Builders continue to confront the same major challenges they have seen over the past year, including competition from the large inventory of distressed homes on the market, inaccurate appraisal values, and issues with their buyers not being able to sell an existing home or qualify for favorable mortgage rates because of overly tight underwriting requirements," said Bob Nielsen, chairman of the National Association of Home Builders (NAHB) and a home builder from Reno, Nev. He noted that 41 percent of respondents to a special questions section of the HMI indicated they had lost sales contracts due to buyers' inability to sell their current homes.
...
Two out of three of the HMI's component indexes posted marginal gains in August. The component gauging current sales conditions gained one point to 16 – its highest level since March of this year – and the component gauging traffic of prospect buyers rose one point to 13 following two consecutive months at 12. However, the component gauging sales expectations for the next six months declined two points to 19, partially offsetting a six-point gain from the last month's revised number.
 Click on graph for larger image in new window.
This graph compares the NAHB HMI (left scale) with single family housing starts (right scale). This includes the August release for the HMI and the June data for starts (July housing starts will be released tomorrow).
Both confidence and housing starts have been moving sideways at a very depressed level for several years.
Residential Remodeling Index at new high in June
by Calculated Risk on 8/15/2011 09:05:00 AM
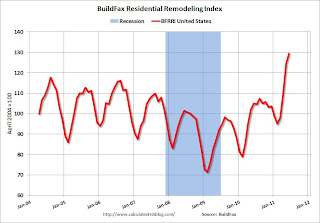
The BuildFax Residential Remodeling Index was at 129.5 in June, up from 124.3 in May. This is based on the number of properties pulling residential construction permits in a given month.
From BuildFax:
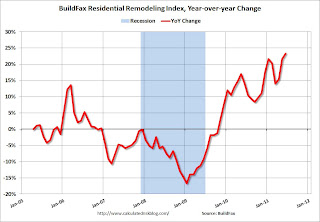
The Residential BuildFax Remodeling Index rose 23% year-over-year--and for the twentieth straight month--in June to 129.5, the highest number in the index to date. Residential remodels in June were up month-over-month 5.2 points (4%) from the May value of 124.3, and up year-over-year 24.5 points from the June 2010 value of 105.0.
...
In June, the West (7.3 points; 6%), the Midwest (11.2 points; 13%), and the South (< .1 points; < 1%) all had month-over-month gains, while the Northeast saw a decline (3.7 points; 4%). ... “The first half of 2011 brought pain to many sectors of the economy including home sales and jobs, however Americans continue to invest in remodeling, sending the BuildFax Remodeling Index to a new all-time high,” said Joe Emison, Vice President of Research and Development at BuildFax. “With so many Americans unable to sell their current home, it is apparent that they are planning on staying in their current residences and are making renovations and upgrades.”
 Click on graph for larger image in graph gallery.
This is the highest level for the index (started in 2004) - even above the levels from 2004 through 2006 during the home equity ("home ATM") withdrawal boom.
Note: Permits are not adjusted by value, so this doesn't mean there is more money being spent, just more permit activity. Also some smaller remodeling projects are done without permits and the index will miss that activity.
 Since there is a strong seasonal pattern for remodeling, the second graph shows the year-over-year change from the same month of the previous year.
The remodeling index is up 23% from June 2010.
Even though new home construction is still moving sideways, it appears that two other components of residential investment will increase in 2011: multi-family construction and home improvement.
Data Source: BuildFax, Courtesy of Index.BuildFax.com
Weekend:
• Summary for Week Ending August 12th
• Schedule for Week of August 14th
Empire State Survey indicates contraction
by Calculated Risk on 8/15/2011 08:30:00 AM
From the NY Fed: Empire State Manufacturing Survey
The August Empire State Manufacturing Survey indicates that conditions for New York manufacturers continued to worsen. The general business conditions index fell four points to -7.7, its third consecutive negative reading. The new orders index also remained below zero, at -7.8, while the shipments index was positive at 3.0.The index decreased from -3.8 in July, and is well below expectations of a reading of 1.0. This is the first regional survey released for August and shows that manufacturing in the NY region is still contracting.
Price indexes continued to retreat, with the prices paid index falling fifteen points to 28.3 and the prices received index falling three points to 2.2. The index for number of employees was slightly positive, while the average workweek index was slightly negative.
Weekend:
• Summary for Week Ending August 12th
• Schedule for Week of August 14th


