by Calculated Risk on 1/10/2012 10:00:00 AM
Tuesday, January 10, 2012
BLS: Job Openings "unchanged" in November
From the BLS: Job Openings and Labor Turnover Summary
The number of job openings in November was 3.2 million, unchanged from October. Although the number of job openings remained below the 4.4 million openings when the recession began in December 2007, the level in November was 1.0 million higher than in July 2009 (the most recent trough for the series). The number of job openings has increased 30 percent since the end of the recession in June 2009.The following graph shows job openings (yellow line), hires (dark blue), Layoff, Discharges and other (red column), and Quits (light blue column) from the JOLTS.
This is a new series and only started in December 2000.
Note: The difference between JOLTS hires and separations is similar to the CES (payroll survey) net jobs headline numbers. This report is for November, the most recent employment report was for December.
 Click on graph for larger image.
Notice that hires (dark blue) and total separations (red and light blue columns stacked) are pretty close each month. When the blue line is above the two stacked columns, the economy is adding net jobs - when it is below the columns, the economy is losing jobs.
Jobs openings declined slightly in November, but the number of job openings (yellow) has generally been trending up, and are up about 7% year-over-year compared to November 2010.
Quits increased in November, and have mostly been trending up - and quits are now up about 12% year-over-year. These are voluntary separations and more quits might indicate some improvement in the labor market. (see light blue columns at bottom of graph for trend for "quits").
NFIB: Small Business Optimism Index increases in December
by Calculated Risk on 1/10/2012 08:10:00 AM
From the National Federation of Independent Business (NFIB): Small Business Confidence Inches Upward: While Economic Winter Continues, It Appears to be Getting Warmer
For the second consecutive month, small-business optimism rose 1.8 points, according to the National Federation of Independent Business (NFIB) Optimism Index; the small but notable gain settled the December reading at 93.8. This represents the fourth monthly increase since September, suggesting that the rising trend might stick. However, a comparative look at early 2011 shows the Index rising in the early part of the year, only to decline in March and April.Note: Small businesses have a larger percentage of real estate and retail related companies than the overall economy.
“Much of December’s gain resulted from the fact that concerns about business conditions over the next six months have subsided and because many small-business owners have improved their expectations for real sales gains in the coming months,” said NFIB Chief Economist Bill Dunkelberg.
 Click on graph for larger image.
The first graph shows the small business optimism index since 1986. The index increased to 93.8 in December from 92.0 in November. This is the fourth increase in a row after declining for six consecutive months.
The second graph shows the net hiring plans for the next three months.
 Hiring plans declined slightly in December, but the trend is up.
 According to NFIB: “Unfortunately, December’s jobs numbers fizzled, with the net change in employment per firm turning negative again; small businesses lost an average .15 workers per firm. ... The good news is that the number of owners cutting jobs has ‘normalized’. In the past several months, reports of those cutting workers have been at the lowest levels since the recession started in December 2007. ... Over the next three months ... a seasonally adjusted net 6 percent of owners planning to create new jobs, a 1 point decline but still one of the strongest readings since September 2008."
The optimism index declined sharply in August due to the debt ceiling debate and has now rebounded to about the same level as early in 2011. This index is still low - probably due to a combination of sluggish growth, and the high concentration of real estate related companies in the index.
Monday, January 09, 2012
Germany and France warn Greece on Debt Deal
by Calculated Risk on 1/09/2012 07:45:00 PM
A couple of articles ...
From the WaPo: France, Germany warn Greece to make debt deal
France and Germany, the European Union’s key powers, insisted Monday that private creditors must take losses to help over-indebted Greece right its finances, but they also warned the Greek government that E.U. rescue funds will be held back unless it makes a deal soon with the increasingly nervous banks holding its debt.From the WSJ: Greek Bailout in Peril
...
“We must see progress on the voluntary restructuring of Greek debt,” Reuters quoted Merkel as telling a joint news conference after the Berlin consultations. “From our point of view, the second Greek aid package, including this restructuring, must be in place quickly. Otherwise, it will not be possible to pay out the next tranche (of the bailout) for Greece.”
The spreading recession in the euro zone is also making it harder for Greece and other countries with bailout programs to close their fiscal deficits, economists said. Greece's stubbornly high deficit is raising the risk of a full-blown default on its bonds ...Usually these negotiations continue right until the last minute. The "spreading recession in the euro zone" isn't helping.
Distressed House Sales using Sacramento Data for December
by Calculated Risk on 1/09/2012 04:20:00 PM
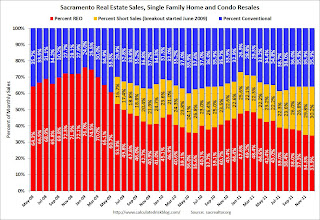
I've been following the Sacramento market to look for changes in the mix of house sales in a distressed area over time (conventional, REOs, and short sales). The Sacramento Association of REALTORS® started breaking out REOs in May 2008, and short sales in June 2009.
This will be interesting once something changes. So far the changes have been minor - mostly a shift from REO to short sales - but the percentage of distressed sales has declined a little year-over-year. At some point, the number and percent of distressed sales should start to decline significantly (excluding seasonal factors and market distortions like the home buyer tax credit).
The percent of distressed sales in Sacramento was unchanged in December compared to November. In December 2011, 64.1% of all resales (single family homes and condos) were distressed sales. This was down from 67.1% in December 2010 - and the lowest percentage of December distressed sales since Sacramento started breaking out the data.
Here are the statistics.
 Click on graph for larger image.
This graph shows the percent of REO sales, short sales and conventional sales. There is a seasonal pattern for conventional sales (stronger in the spring and summer), and distressed sales happen all year - so the percentage of distressed sales decreases every summer and the increases in the fall and winter.
Total sales were up 10.1% compared to December 2010. Active Listing Inventory declined 42.5% from last December, although "short sale contingent" has increased. Cash buyers accounted for 30.8% of all sales (frequently investors), and median prices are off about 10% from last December.
This data might be helpful in determining when the market is improving. So far it looks like REO sales have declined (this is the lowest percentage of REO sales since Sacramento started breaking out REOs), mostly offset by an increase in short sales, and just a slight decline in the total percent of distressed sales. Also inventory has plummeted.
Question #3 for 2012: Will foreclosure activity increase in 2012?
by Calculated Risk on 1/09/2012 01:30:00 PM
Earlier I posted some questions for next year: Ten Economic Questions for 2012. I'm trying to add some thoughts, and a few predictions for each question.
3) Distressed house sales: Foreclosure activity is still very high, although activity slowed in 2011 because of "foreclosure gate" issues. The number of REOs (Real Estate Owned by lenders) also declined in 2011. Will foreclosure activity increase in 2012?
This is a difficult question. There are several significant policy changes in the works: 1) a possible Mortgage Settlement, 2) HARP refinance (the automated program starts in March), and 3) a REO to rental program. (See: Housing Policy Changes). It appears the overall goal of these policy changes is to reduce the large backlog of seriously delinquent loans while, at the same time, not flood the housing market with distressed homes.
Note: Diana Olick at CNBC has an update on the REO to rental program today: Government Set to Sell Foreclosures in Bulk
The Obama administration, in conjunction with federal regulators and led by the overseer of Fannie Mae and Freddie Mac, is very close to announcing a pilot program to sell government-owned foreclosures in bulk to investors as rentals, according to administration officials.Here are some charts on REOs and delinquencies:
The first is just inventory for Fannie, Freddie and the FHA.
 Click on graph for larger image.
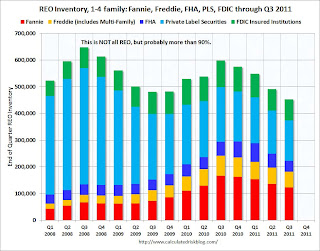
This graph shows the REO inventory for Fannie, Freddie and FHA through Q3 2011.
The REO inventory for the "Fs" increased sharply in 2010, but may have peaked in Q4 2010. However there may be a new peak when the foreclosure dam breaks (after the settlement) - however I expect quite a few modifications as part of the settlement too, and also a bulk REO selling program from Fannie and Freddie.
 The Fannie, Freddie, FHA, PLS, FDIC REO decreased to about 455,000 in Q3 from just under 500,000 in Q2.
As Tom Lawler has noted: "This is NOT an estimate of total residential REO, as it excludes non-FHA government REO (VA, USDA, etc.), credit unions, finance companies, non-FDIC-insured banks and thrifts, and a few other lender categories." However this is the bulk of the 1-4 family REO - probably 90% or more. Rounding up the estimate (using 90%) suggests total REO is just around 500,000 in Q3.
REO inventories have declined over the last year, however there are many more to come.
 One of the key issues is the number of delinquent loans (and loans in the foreclosure process). I use the Mortgage Bankers Association (MBA) quarterly data and LPS Applied Analytics monthly data to track delinquencies.
This graph based on the MBA quarterly data shows the percent of loans delinquent by days past due. The MBA reported that 12.42 percent of mortgage loans were either one payment delinquent or in the foreclosure process in Q3 2011 (delinquencies seasonally adjusted).
 This graph provided by LPS Applied Analytics shows the percent delinquent, percent in foreclosure, and total non-current mortgages through November 2011.
The total delinquent rate has fallen to 8.15% from the peak in January 2010 of 10.97%, but the decline has "halted". The in-foreclosure rate was at 4.16%, down from the record high last month of 4.29%. There are still a large number of loans in this category (about 2.21 million).
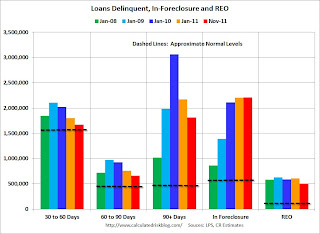
The last graph shows the delinquent and REO buckets over time. The delinquency data is from LPS, and the REO estimates are based on work by Tom Lawler and my own calculations.
 The dashed lines are "normal" historical levels for each bucket. The 30 day bucket is only slightly elevated (as of November), and the 60 day buckets is somewhat elevated. But the glaring problems are in the 90 day and in-foreclosure buckets.
There are 4 million seriously delinquent loans (90 day and in-foreclosure). This is about 3 million more properties than normal. Probably when the mortgage settlement is announced, some of these loans will cure as part of the settlement with loan modifications that include principal reduction, but many of these properties will become REOs fairly quickly.
So even though REO inventory is declining, there are still many more to come - and this doesn't include all the homeowners with negative equity who may default in the future (although the refinance programs are aimed at keeping many of these borrowers from defaulting).
My guess is the policy changes will all be announced in the next few months, and that foreclosure activity will increase significantly. Some portion of these REO will be sold in bulk to investors and rented, so it is difficult to tell how many REOs will come on the market.
Earlier:
• Question #4 for 2012: U.S. Economic Growth
• Question #5 for 2012: Employment
• Question #6 for 2012: Unemployment Rate
• Question #7 for 2012: State and Local Governments
• Question #8 for 2012: Europe and the Euro
• Question #9 for 2012: Inflation
• Question #10 for 2012: Monetary Policy


