by Calculated Risk on 3/16/2012 01:23:00 PM
Friday, March 16, 2012
Key Measures of Inflation in February
Earlier today the BLS reported:
The Consumer Price Index for All Urban Consumers (CPI-U) increased 0.4 percent in February on a seasonally adjusted basis ... The index for all items less food and energy rose 0.1 percent in FebruaryThe Cleveland Fed released the median CPI and the trimmed-mean CPI this morning:
According to the Federal Reserve Bank of Cleveland, the median Consumer Price Index rose 0.1% (1.7% annualized rate) in February. The 16% trimmed-mean Consumer Price Index rose 0.1% (1.3% annualized rate) during the month.Note: The Cleveland Fed has the median CPI details for February here.
...
The CPI less food and energy increased 0.1% (1.2% annualized rate) on a seasonally adjusted basis.
 Click on graph for larger image.
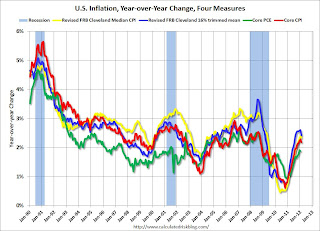
This graph shows the year-over-year change for these four key measures of inflation. On a year-over-year basis, the median CPI rose 2.3%, the trimmed-mean CPI rose 2.4%, and core CPI rose 2.2%. Core PCE is for February and increased 1.88% year-over-year.
These measures show inflation on a year-over-year basis is still above the Fed's 2% target, however on a monthly basis, the rate of increase was below the Fed's target.
Consumer Sentiment declines in March to 74.3
by Calculated Risk on 3/16/2012 09:55:00 AM

Click on graph for larger image.
The preliminary Reuters / University of Michigan consumer sentiment index for March declined to 74.3, down from the February reading of 75.3.
This was below the consensus forecast of an increase to 75.6. Overall sentiment is still fairly weak, although sentiment has rebounded from the decline last summer.
Industrial Production unchanged in February, Capacity Utilization declines
by Calculated Risk on 3/16/2012 09:15:00 AM
From the Fed: Industrial production and Capacity Utilization
Industrial production was unchanged in February after having risen 0.4 percent in January. Previously, industrial production was reported to have been unchanged in January. Manufacturing output moved up 0.3 percent in February. ... At 96.2 percent of its 2007 average, total industrial production for February was 4.0 percent above its year-earlier level. Capacity utilization for total industry edged down to 78.7 percent, a rate 1.2 percentage points above its level from a year earlier but 1.6 percentage points below its long-run (1972--2011) average.
 Click on graph for larger image.
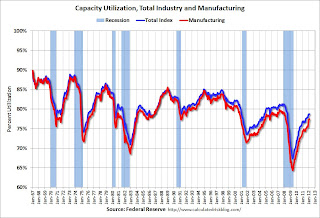
This graph shows Capacity Utilization. This series is up 11.3 percentage points from the record low set in June 2009 (the series starts in 1967).
Capacity utilization at 78.7% is still 1.6 percentage points below its average from 1972 to 2010 and below the pre-recession levels of 81.3% in December 2007. Capacity utilization for January was revised up from 78.5% to 78.8%.
Note: y-axis doesn't start at zero to better show the change.
 The second graph shows industrial production since 1967.
Industrial production was unchanged in February at 96.2; however January was revised up 0.4%.
The consensus was for a 0.4% increase in Industrial Production in February, and for an increase to 78.8% (from 78.5%) for Capacity Utilization. Although below consensus, with the January revisions, this was close to expectations.
BLS: CPI increases 0.4% in February
by Calculated Risk on 3/16/2012 08:30:00 AM
The Consumer Price Index for All Urban Consumers (CPI-U) increased 0.4 percent in February on a seasonally adjusted basis, the U.S. Bureau of Labor Statistics reported today. Over the last 12 months, the all items index increased 2.9 percent before seasonal adjustment.I'll post a graph later today after the Cleveland Fed releases the median and trimmed-mean CPI. This was below the consensus forecast of a 0.5% increase in CPI and a 0.2% increase in core CPI.
The gasoline index rose sharply in February, accounting for over 80 percent of the change in the all items index. ...
The index for all items less food and energy rose 0.1 percent in February after increasing 0.2 percent in January.
Thursday, March 15, 2012
Housing: Seasonality for Searches, Starts, Sales and Prices
by Calculated Risk on 3/15/2012 08:25:00 PM
Jed Kolko, Trulia's chief economist writes about housing seasonality today: Springtime for Housing
The housing market rides the seasons. Year in and year out, market activity has predictable ups and downs. Sometimes those seasonal patterns are hard to see when longer-term trends (like plummeting housing prices) or one-off events (like the homebuyer tax credit) drive movements in prices, sales and other housing indicators. But seasonal patterns are there, even when they’re beneath the surface.
...
In this post, I look at five measures of housing activity: search activity, asking prices, new construction starts, existing home sales and housing inventory.
...
The chart below shows that sales are typically 29% above their annual average in June and 31% below their annual average in January. Construction starts also swing 25% above and below their annual average over the year. ... Search activity rises 12% above its annual average in March. But inventories stay within 10% of their annual average every month, and asking prices stay within 5% of their annual average every month.
 Click on graph for larger image.
This is one of three graphics in Kolko's post. Note that Kolko is using asking prices, and not a repeat sales index like Case-Shiller.
This shows housing is definitely seasonal, especially starts, sales and searches. The other graphics show when activity is high and low for each measure (searches peak in March and stay high through August), and when prices peak by region (earlier in the south, later in the north).


