by Calculated Risk on 3/17/2012 04:25:00 PM
Saturday, March 17, 2012
Unofficial Problem Bank list declines to 952 Institutions
This is an unofficial list of Problem Banks compiled only from public sources.
Here is the unofficial problem bank list for March 16, 2012. (table is sortable by assets, state, etc.)
Changes and comments from surferdude808:
As expected, the OCC release its actions through mid-February 2012 this week, which contributed to several changes to the Unofficial Problem Bank List.
In all, there were six removals and two additions, which leaves the list with 952 institutions with assets of $379.1 billion. Among the removals are one unassisted merger -- Mainline National Bank, Portage, PA ($235 million). The other removals are for action terminations including City National Bank of Florida, Miami, FL ($3.97 billion); Edgewater Bank, Saint Joseph, MI ($137 million); Bank of the Rio Grande, National Association, Las Cruces, NM ($102 million); First National Bank in Mahnomen, Mahnomen, MN ($72 million); and The First National Bank of Wayne, Wayne, NE ($35 million). The two additions this week were Lee County Bank & Trust, National Association, Fort Madison, IA ($163 million) and Mutual Federal Bank, Chicago, IL ($83 million).
 Click on graph for larger image.
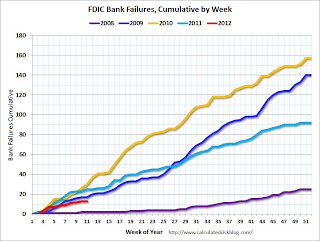
This graph shows the cumulative bank failures for each year starting in 2008. There have been 427 bank failures since the beginning of 2008, and so far closings this year are running at about half the rate of 2010 and 2011.
Earlier:
• Summary for Week ending March 16th
• Schedule for Week of March 18th
Schedule for Week of March 18th
by Calculated Risk on 3/17/2012 01:01:00 PM
Earlier:
• Summary for Week ending March 16th
The key reports this week are housing related. This includes the NAHB builder confidence survey on Monday, housing starts on Tuesday, existing home sales on Wednesday, and new home sales on Friday.
The AIA's Architecture Billings Index for January will also be released on Wednesday.
8:35 AM ET: NY Fed President Dudley speaks on regional and national economic conditions before the Long Island Association
9:30 AM: Testimony, Suzanne Killian, Senior Associate Director, Division of Consumer and Community Affairs, "Foreclosures and the Housing Market" Before the Committee on Government Oversight and Reform, U.S. House of Representatives, Brooklyn, New York
10:00 AM: The March NAHB homebuilder survey. The consensus is for a reading of 30, up slightly from 29 in February. Although this index has been increasing lately, any number below 50 still indicates that more builders view sales conditions as poor than good.
 8:30 AM: Housing Starts for February.
 This shows the huge collapse following the housing bubble, and that total housing starts have been increasing a little lately after mostly moving sideways for about two years and a half years. Multi-family starts increased in 2011 - although from a very low level - and single family starts appear to be increasing lately.
The consensus is for total housing starts to be essentially unchanged at 700,000 (SAAR) in February.
12:45 PM: Fed Chairman Ben Bernanke's lecture series to college students, "The Federal Reserve and the Financial Crisis" Part 1 of 4
7:00 AM: The Mortgage Bankers Association (MBA) will release the mortgage purchase applications index. This index has been weak this year, although this does not include all the cash buyers.
 10:00 AM: Existing Home Sales for February from the National Association of Realtors (NAR).
 The consensus is for sales of 4.61 million on seasonally adjusted annual rate basis.
Economist Tom Lawler estimates the NAR will report sales of 4.63 million, up slightly from January’s pace. A key will be inventory and months-of-supply, and Lawler estimates inventory increased slightly in February.
During the day: The AIA's Architecture Billings Index for February (a leading indicator for commercial real estate).
8:30 AM: The initial weekly unemployment claims report will be released. The consensus is for claims to increase to 352,000 from 351,000 last week.
10:00 AM: FHFA House Price Index for January 2011. This is based on GSE repeat sales and is no longer as closely followed as Case-Shiller (or CoreLogic).
10:00 AM: Conference Board Leading Indicators for February. The consensus is for a 0.6% increase in this index.
12:45 PM: Fed Chairman Ben Bernanke's lecture series to college students, "The Federal Reserve and the Financial Crisis" Part 2 of 4
 10:00 AM ET: New Home Sales for February from the Census Bureau.
 This graph shows New Home Sales since 1963. The dashed line is the current sales rate.
The consensus is for a slight increase in sales to 325 thousand Seasonally Adjusted Annual Rate (SAAR) in February from 321 thousand in January. The consensus might be a little low based on the homebuilder confidence survey.
Summary for Week ending March 16th
by Calculated Risk on 3/17/2012 08:16:00 AM
There were several key stories this week: 15 of 19 large bank holding companies passed the recent Fed stress tests, the mortgage settlement was filed with the court, and, over in Europe, the IMF and EU approved new funding for Greece.
The U.S. economic data was mostly positive. Retail sales in February increases 1.1% from January, weekly initial unemployment claims declined to 351,000, and core inflation eased slightly (although overall inflation was up sharply due to higher gasoline prices). Gasoline prices probably pushed down consumer sentiment a little in March.
For manufacturing, industrial production and capacity utilization were a little weaker than expected, although January was revised up. And the Empire State and Philly Fed surveys showed stronger expansion in March.
Overall a positive week. Next week will be mostly about housing.
Here is a summary in graphs:
• Retail Sales increased 1.1% in February
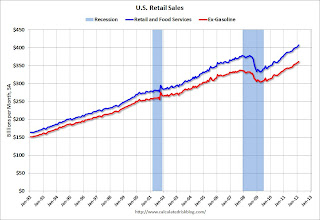 On a monthly basis, retail sales were up 1.1% from January to February (seasonally adjusted, after revisions), and sales were up 6.5% from February 2011. Ex-autos, retail sales increased 0.9% in February.
Sales for January were revised up from a 0.4% increase to a 0.6% increase.
This graph shows retail sales since 1992. This is monthly retail sales and food service, seasonally adjusted (total and ex-gasoline).
Retail sales are up 22.6% from the bottom, and now 7.8% above the pre-recession peak (not inflation adjusted)
This was below the consensus forecast for retail sales of a 1.2% increase in February, but above the consensus for a 0.8% increase ex-auto.
• Industrial Production unchanged in February, Capacity Utilization declines
 From the Fed: Industrial production and Capacity Utilization
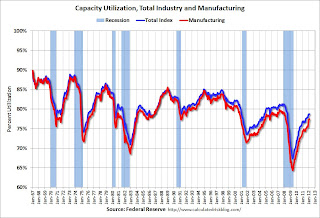
 This graph shows Capacity Utilization. This series is up 11.3 percentage points from the record low set in June 2009 (the series starts in 1967).
Capacity utilization at 78.7% is still 1.6 percentage points below its average from 1972 to 2010 and below the pre-recession levels of 81.3% in December 2007. Capacity utilization for January was revised up from 78.5% to 78.8%.
Note: y-axis doesn't start at zero to better show the change.
 The second graph shows industrial production since 1967.
Industrial production was unchanged in February at 96.2; however January was revised up 0.4%.
The consensus was for a 0.4% increase in Industrial Production in February, and for an increase to 78.8% (from 78.5%) for Capacity Utilization. Although below consensus, with the January revisions, this was close to expectations.
• Philly Fed and Empire State Manufacturing Surveys indicate slightly stronger expansion in March
From the Philly Fed: March 2012 Business Outlook Survey "The survey's broadest measure of manufacturing conditions, the diffusion index of current activity, edged slightly higher, from a reading of 10.2 in February to 12.5, its highest reading since April of last year"
From the NY Fed: Empire State Manufacturing Survey "The general business conditions index was little changed in March and, at 20.2, indicated a continued moderate pace of growth in business activity for New York State manufacturers."
 Here is a graph comparing the regional Fed surveys and the ISM manufacturing index. The dashed green line is an average of the NY Fed (Empire State) and Philly Fed surveys through March. The ISM and total Fed surveys are through February.
The average of the Empire State and Philly Fed surveys increased slightly again in March, and is at the highest level since April 2011.
Both surveys indicated expansion in March, at a slightly faster pace than in February, and both were slightly above the consensus forecast.
• Weekly Initial Unemployment Claims decline to 351,000
 The dashed line on the graph is the current 4-week average. The four-week average of weekly unemployment claims was unchanged at 355,750.
The 4-week moving average is near the lowest level since early 2008.
• Key Measures of Inflation in February
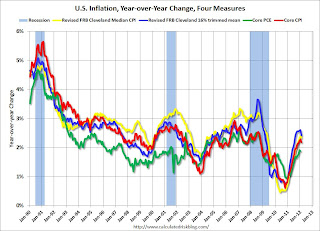 This graph shows the year-over-year change for four key measures of inflation: Core CPI, trimmed-mean CPI, median CPI, and core PCE. On a year-over-year basis, the median CPI rose 2.3%, the trimmed-mean CPI rose 2.4%, and core CPI rose 2.2%. Core PCE is for February and increased 1.88% year-over-year.
 These measures show inflation on a year-over-year basis is still above the Fed's 2% target, however on a monthly basis, the rate of increase was below the Fed's target.
• BLS: Job Openings unchanged in January
 This graph shows job openings (yellow line), hires (dark blue), Layoff, Discharges and other (red column), and Quits (light blue column) from the JOLTS.
 This is a new series and only started in December 2000.
Notice that hires (dark blue) and total separations (red and light blue columns stacked) are pretty close each month. When the blue line is above the two stacked columns, the economy is adding net jobs - when it is below the columns, the economy is losing jobs.
Jobs openings were unchanged in January, and the number of job openings (yellow) has generally been trending up, and are up about 21% year-over-year compared to January 2011.
Quits declined slightly in January, and quits are now up about 9% year-over-year. These are voluntary separations and more quits might indicate some improvement in the labor market. (see light blue columns at bottom of graph for trend for "quits").
• Consumer Sentiment declines in March to 74.3
 The preliminary Reuters / University of Michigan consumer sentiment index for March declined to 74.3, down from the February reading of 75.3.
This was below the consensus forecast of an increase to 75.6 and the decline was probably related to higher gasoline prices. Overall sentiment is still fairly weak, although sentiment has rebounded from the decline last summer.
• NFIB: Small Business Optimism increases slightly in February
From the National Federation of Independent Business (NFIB): Historically Low Business Confidence Begins to Edge Up, Ever so Slightly
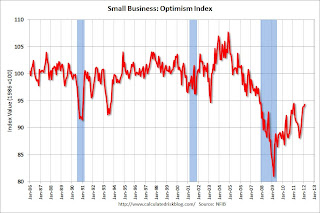 This graph shows the small business optimism index since 1986. The index increased to 94.3 in February from 93.9 in January. This is the sixth increase in a row after for the index, and the index is now at second highest level since December 2007 (the index was slightly higher - at 94.5 - in February 2011).
This index is still low - probably due to a combination of sluggish growth, and the high concentration of real estate related companies in the index.
• Other Economic Stories ...
• Mortgage Settlement filed with Court
• State Unemployment Rates "generally lower" in January
• LA area Port Traffic declines in February
• FOMC Statement: No changes, economy "expanding moderately"
• Fed: 15 of 19 Banks passed adverse stress test scenario
Friday, March 16, 2012
Norris: Full Service Restaurants and Okun's Law
by Calculated Risk on 3/16/2012 08:29:00 PM
From Floyd Norris at the NY Times: In Sit-Down Restaurants, an Economic Indicator
Over the 12 months through January, sales at what the government calls full-service restaurants were 8.7 percent higher than in the previous 12 months. That was the fastest pace of growth since the late 1990s, when the economy was booming. Moreover, as is seen in the accompanying charts, that rate was much greater than the rate of growth in sales at limited-service restaurants.The numbers Norris is using are from the Census Bureau's Monthly Retail Trade Report and released with a lag.
Since those numbers became available 20 years ago, that difference has been a reliable indicator of how the economy is going. In tough times, people may still eat out, but they cut back.
Norris points out the full service restaurants are performing better than the economy (just like the current debate about Okun's law, see Jon Hilsenrath's Piecing Together the Job-Picture Puzzle and Tim Duy's Thoughts on Okun's Law).
Norris wonders if the improvement in full service restaurants suggests upward revisions when the 2011 benchmark revisions for GDP are released in July. Maybe.
Lawler: Early Read on Existing Home Sales in February
by Calculated Risk on 3/16/2012 02:41:00 PM
From economist Tom Lawler:
Based on the incoming data I’ve seen so far, I estimate that existing home sales (as reported by the NAR) ran at a seasonally adjusted annual rate of around 4.63 million in February, up 1.3% from January’s pace (which in my mind should be revised upward).
While at first glance the exceptionally strong YOY gains reported by a decent number of realtor associations/boards/MLS might suggest a stronger sales report, one should take into account (1) last February’s relatively weak sales pace; (2) this is a “leap year,” and this February (obviously) had an extra business day (and as a result this February’s seasonal factor is larger than last February’s); and (3) there were some key markets where YOY sales gains were either pretty modest or, for several Florida markets, actually down from a year ago (reflecting substantial declines in REO sales and inventories). E.g., mid-Atlantic sales showed only modest gains, as did some other northeast market (though Massachusetts saw a huge jump), several California markets, and South Carolina (though most North Carolina markets saw hefty YOY increases.)
I should note that recently my projections of the NAR’s numbers have been off by more than they used to be, and perhaps not coincidentally ever since the NAR’s “re-benchmarking.” I don’t know why. I still, e.g., have trouble “explaining” the January NAR report. The NAR’s Midwest sales numbers especially don’t “jive” with state realtor reports (which clearly suggested a much stronger YOY gain than that shown by the NAR), for reasons that are not clear (at least to me).
On the inventory side, I’d guess that the NAR’s existing home inventory number will probably show a small monthly increase, but the YOY decline is likely to increase to about 22% or so to 2.35 million.
On the median sales price side, this February a larger number of associations/boards/MLS reported YOY gains than was the case in January, and most (though by no means all) of A/B/M’s reporting a YOY drop showed a smaller YOY decline in February vs. January. In some Florida markets the huge YOY decline in foreclosure sales was a major reason for reported YOY price gains, but there were gains in other markets not experiencing significant foreclosure share declines. Net, I would “guesstimate” that the median existing SF sales price in February will be down just 0.3% from last February.
On a final note, several realtor associations/boards/MLS have reported SIZABLE YOY gains in pending home sales in February. While I don’t yet have a good “guesstimate” for the NAR’s PHSI release (it’s hard to do, as many A/B/M’s don’t report “new” pending sales), a quick look at reports so far suggest that there could be a pretty sizable increase in the NAR’s Pending Home Sales Index in February.
CR Note: Tom's estimates for sales have always been very close. He was off some in January (his estimate was 4.76 million and the NAR reported 4.57 million SAAR), but he was very close in December (4.64 vs. 4.61).
Based on Tom's estimates for sales and inventory, this would put months-of-supply at 6.1 months, essentially unchanged from January.
The NAR will report February existing home sales next week on Wednesday March 21st and the current consensus is for sales of 4.60 million SAAR.


