by Calculated Risk on 4/06/2012 10:17:00 AM
Friday, April 06, 2012
Employment Summary and Discussion
The number of payroll jobs added in March was disappointing, and this is reminding many observers of the slowdown in 2011.
But we also have to remember that this is just one month, and that there were clear reasons for the slowdown last year. In 2011, the economy was negatively impacted by the tsunami, bad weather, high oil prices and the debt ceiling debate. Of course oil prices are high again, but hopefully there will be no natural disasters, and also no threats of defaulting on the debt.
The report wasn't all bad news. It looks like the drag from state and local layoffs is nearing the end, the unemployment rate declined (although partially because of workers leaving the labor force), the number of people working part time for economic reasons declined, and the number of people unemployed for more than 6 months declined - and hourly wages increased a little faster.
Some numbers: There were 120,000 payroll jobs added in March, with 121,000 private sector jobs added, and 1,000 government jobs lost. The unemployment rate declined to 8.2%. U-6, an alternate measure of labor underutilization that includes part time workers and marginally attached workers, declined to 14.5% from 14.9% in February. This remains very high - U-6 was in the 8% range in 2007 - but this is the lowest level of U-6 since early 2009.
The participation rate decreased slightly to 63.8% (from 63.9%) and the employment population ratio also decreased slightly to 58.5%.
The change in January payroll employment was revised down from +284,000 to +275,000, and February was revised up from +227,000 to +240,000.
The average workweek declined 0.1 hours to 34.5 hours, and average hourly earnings increased 0.2%. "The average workweek for all employees on private nonfarm payrolls edged down by 0.1 hour to 34.5 hours in March. ... In March, average hourly earnings for all employees on private nonfarm payrolls rose by 5 cents, or 0.2 percent, to $23.39." This is sluggish earnings growth, and earnings are still being impacted by the large number of unemployed and marginally employed workers.
There are a total of 12.67 million Americans unemployed and 5.3 million have been unemployed for more than 6 months. These numbers are declining, but still very high.
Overall this report was disappointing, and this report will make the April report even more important as analysts try to determine if this is the beginning of slower growth - or if this was just a one month slowdown in hiring.
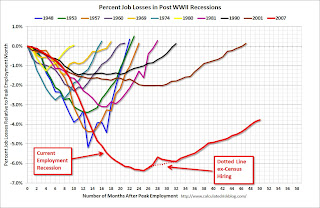
Percent Job Losses During Recessions
 Click on graph for larger image.
This graph shows the job losses from the start of the employment recession, in percentage terms - this time aligned at maximum job losses.
In the previous post, the graph showed the job losses aligned at the start of the employment recession.
Part Time for Economic Reasons
 From the BLS report:
The number of persons employed part time for economic reasons (sometimes referred to as involuntary part-time workers) fell from 8.1 to 7.7 million over the month. These individuals were working part time because theirThe number of part time workers decreased sharply in March - and is back to 2008 levels - but this is still very high.
hours had been cut back or because they were unable to find a full-time
job.
These workers are included in the alternate measure of labor underutilization (U-6) that declined to 14.5% in March from 14.9% in February - the lowest level since early 2009.
Unemployed over 26 Weeks
 This graph shows the number of workers unemployed for 27 weeks or more.
 According to the BLS, there are 5.308 million workers who have been unemployed for more than 26 weeks and still want a job. This was down from 5.426 million in February. This is very high, but this is the lowest number since 2009.
More graphs coming ...
March Employment Report: 120,000 Jobs, 8.2% Unemployment Rate
by Calculated Risk on 4/06/2012 08:30:00 AM
From the BLS:
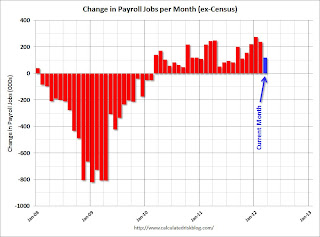
Nonfarm payroll employment rose by 120,000 in March, and the unemployment rate was little changed at 8.2 percent, the U.S. Bureau of Labor Statistics reported today.This graph shows the jobs added or lost per month (excluding temporary Census jobs) since the beginning of 2008.
...
The civilian labor force participation rate (63.8 percent) and the employment-population ratio (58.5 percent) were little changed in March.
...
The change in total nonfarm payroll employment for January was revised from
+284,000 to +275,000, and the change for February was revised from +227,000
to +240,000.
 Click on graph for larger image.
Job growth started picking up early last year, but then the economy was hit by a series of shocks (oil price increase, tsunami in Japan, debt ceiling debate) - and then growth started picking up again. This is only one month, but the concern is job growth will slow again.
The second graph shows the employment population ratio, the participation rate, and the unemployment rate. The unemployment rate was declined to 8.2% (red line).
 The Labor Force Participation Rate decreased to 63.8% in March (blue line). This is the percentage of the working age population in the labor force. The participation rate is well below the 66% to 67% rate that was normal over the last 20 years, although most of the decline is due to demographics.
The Employment-Population ratio decreased slightly to 58.5% in March (black line).
 The third graph shows the job losses from the start of the employment recession, in percentage terms. The dotted line is ex-Census hiring.
This shows the depth of the recent employment recession - much worst than any other post-war recession - and the relatively slow recovery due to the lingering effects of the housing bust and financial crisis.
This was weaker payroll growth than expected (expected was 201,000). More later ...
Reis: Strip Mall Vacancy Rate declines slightly in Q1
by Calculated Risk on 4/06/2012 12:44:00 AM
From Reuters: US strip-mall vacancy falls 1st time in 7 yrs
The average vacancy rate at U.S. strip malls fell for the first time in nearly seven years in the first quarter and rents inched up, but it is too early to call a rebound for a sector battered by the housing bust and recession, a report by Reis Inc showed.
During the first quarter, the national vacancy rate for strip malls fell to 10.9 percent from 11 percent the prior quarter, according to preliminary figures from Reis. ... "This is really only the first quarter where the vacancy rate declined. We need to see something a little bit more sustained than just a quarter or two before it really signals the beginning of a trend," Severino said.
...
At regional malls, the first-quarter vacancy rate fell to 9 percent from 9.2 percent the prior quarter. It was the second consecutive quarterly decline for the big malls.
 Click on graph for larger image.
This graph shows the vacancy rate for regional and strip malls since Q1 2000.
It appears the vacancy rate is starting to decline, but very slowly. Just like for office space, there is almost no new supply of malls being built.
Thursday, April 05, 2012
Existing Home Inventory declines 20% year-over-year in early April
by Calculated Risk on 4/05/2012 09:33:00 PM
Another update: I've been using inventory numbers from HousingTracker / DeptofNumbers to track changes in inventory. Tom Lawler mentioned this last year.
According to the deptofnumbers.com for (54 metro areas), inventory is off 20.4% compared to the same week last year. Unfortunately the deptofnumbers only started tracking inventory in April 2006.
This graph shows the NAR estimate of existing home inventory through February (left axis) and the HousingTracker data for the 54 metro areas through early April.
 Click on graph for larger image.
Since the NAR released their revisions for sales and inventory, the NAR and HousingTracker inventory numbers have tracked pretty well.
Seasonally housing inventory usually bottoms in December and January and then starts to increase again through mid to late summer. So seasonally inventory should increase over the next several months.
The second graph shows the year-over-year change in inventory for both the NAR and HousingTracker.
 HousingTracker reported that the early April listings - for the 54 metro areas - declined 20.4% from the same period last year. The year-over-year decline will probably start to slow since listed inventory is getting close to normal levels. Also if there is an increase in foreclosures (as expected), this will slow the year-over-year decline.
This is just inventory listed for sale, there is also a large "shadow inventory" that is currently not on the market, but is expected to be listed in the next few years. But this year-over-year decline remains a significant story.
Federal Reserve Issues Statement on Rental of REOs
by Calculated Risk on 4/05/2012 05:20:00 PM
This statement makes it clear that the Fed (and probably other regulators) will allow banks to rent residential Real Estate Owned (REO) for longer periods due to market conditions. I expect we will see more rental programs like the pilot program recently announced by BofA.
From the Federal Reserve:
The Federal Reserve Board on Thursday released a policy statement reiterating that statutes and Federal Reserve regulations permit rental of residential properties acquired in foreclosure as part of an orderly disposition strategy. The statement also outlines supervisory expectations for residential rental activities.Here is the statement.
The general policy of the Federal Reserve is that banking organizations should make good faith efforts to dispose of foreclosed properties (also known as "other real estate owned" or "OREO"), including single-family homes, at the earliest practicable date. In this context, and in light of the extraordinary market conditions that currently prevail, the policy statement explains that banking organizations may rent residential OREO properties within legal holding-period limits without demonstrating continuous active marketing of the property for sale, provided that suitable policies and procedures are followed.
Moreover, to the extent that OREO rental properties meet the definition of community development under the Community Reinvestment Act (CRA) regulations, the banking organizations would receive favorable CRA consideration. In all respects, banking organizations that rent OREO properties are expected to comply with all applicable federal, state, and local statutes and regulations, some of which the policy statement highlights. The policy statement, in providing guidance to banking organizations and examiners, also describes specific supervisory expectations for banking organizations with a larger number of rental OREO properties, generally more than 50 properties available for rent or rented.
The policy statement applies to banking organizations for which the Federal Reserve is the primary federal supervisor, including state member banks, bank holding companies, non-bank subsidiaries of bank holding companies, savings and loan holding companies, non-thrift subsidiaries of savings and loan holding companies, and U.S. branches and agencies of foreign banking organizations.


