by Calculated Risk on 11/07/2012 09:49:00 AM
Wednesday, November 07, 2012
Hurricane Sandy: Impact on "Near-Term Economic Activity"
The economic data has already shown some impact from Hurricane Sandy, and we will see more over the next couple of months. As an example, auto sales were down in the Northeast at the end of October, home listings were down in New York and New Jersey in early November, and this morning the MBA reported mortgage applications were down sharply in those states.
Goldman Sachs analysts Sven Jari Stehn and Shuyan Wu tried to quantify the short term impact: The Effect of Hurricane Sandy on Near-Term Economic Activity
1. Employment dips and rebounds ... Both nonfarm payrolls and household employment typically fall one month after landfall and then rebound in the following two months. Our estimates suggest that the hit of Hurricane Sandy on November employment might be around 20,000 with a rebound in December and January. ...This will be something to keep in my mind as data is released over the next couple of months. Best wishes to all recovering from the hurricane.
2. ...as claims rise and fall slowly. Initial jobless claims typically rise over the first three weeks after landfall before gradually falling back over the subsequent two months. Our analysis suggests that Hurricane Sandy might push initial jobless claims up by around 14,000 in the week ended November 17 and that it might take until late December for the distortion to disappear entirely from the claims report.
3. Small effects on housing and manufacturing. ... we find that housing starts tend to rise only by a few thousand units in the aftermath of storms as rebuilding of damaged houses begins. Regional manufacturing surveys typically weaken following hurricanes, but the effect is small. Our results would suggest that manufacturing surveys in the affected states—the Empire and Philadelphia Fed indexes—might weaken temporarily by a point or two in December due to Hurricane Sandy, but this is likely to be hard to distinguish from statistical noise.
...
[W]e conclude that we should expect a notable hit to labor market indicators but only small effects on regional manufacturing surveys and construction activity over the next couple of months.
MBA: Hurricane Sandy Leads to Decrease in Mortgage Applications
by Calculated Risk on 11/07/2012 07:02:00 AM
From the MBA: Storm Leads to Decrease in Mortgage Applications
The Refinance Index ... decreased 5 percent from the previous week. The Refinance Index has declined for five straight weeks and is at its lowest level since the end of August. The seasonally adjusted Purchase Index decreased 5 percent from one week earlier.Some of this decline in activity was related to Hurricane Sandy.
“Last week’s storm had a significant impact on application volumes on the East Coast,” said Mike Fratantoni, MBA’s Vice President of Research and Economics. “Applications fell more than 60 percent compared to the prior week in New Jersey, almost 50 percent in New York and nearly 40 percent in Connecticut. Other East Coast states also saw declines over the week, while many states in other parts of the country had increases in application volumes.”
The average contract interest rate for 30-year fixed-rate mortgages with conforming loan balances ($417,500 or less) decreased to 3.61 percent from 3.65 percent, with points increasing to 0.45 from 0.39 (including the origination fee) for 80 percent loan-to-value ratio (LTV) loans.
 Click on graph for larger image.
This graph shows the MBA mortgage purchase index. The purchase index has been mostly moving sideways over the last two years.
As Fratantoni noted, some states in the Northeast had a sharp decline in activity: "Applications fell more than 60 percent compared to the prior week in New Jersey, almost 50 percent in New York and nearly 40 percent in Connecticut." Most of those areas will bounce back fairly quickly.
Tuesday, November 06, 2012
Election Day
by Calculated Risk on 11/06/2012 05:09:00 PM
A new post for comments and a few election resources:
The WSJ is free online tonight.
CNBC: National election results
From the WaPo: Coming at 6 p.m. ET: Live election results for each state and county
Times polls close in a few key states:
7 PM ET: Polls close in Virginia.
7:30 PM ET: Polls close in Ohio and North Carolina.
8:00 PM: Polls close in Florida and New Hampshire.
9:00 PM: Polls close in Wisconsin and Colorado.
10:00 PM: Polls close in Nevada and Iowa.
Note: I'll add more resources based on comments ...
UPDATE FROM Nemo:
Intrade
Betfair (Take reciprocals of the back/lay numbers to get probabilities)
Profoundly strange (Betting market manipulation? at Self Evident )
UPDATE 2:
Nate Silver's FiveThirtyEight
Ezra Klein's Wonkblog
Lawler: Table of Short Sales and Foreclosures for Selected Cities in September
by Calculated Risk on 11/06/2012 03:20:00 PM
Economist Tom Lawler sent me this today with this note: "I found a few more realtor reports on distressed sales shares for the third quarter."
Previous comments: A couple of clear patterns have developed:
1) There has been a shift from foreclosures to short sales. Foreclosures are down and short sales are up in most areas. For two cities, Las Vegas and Reno, short sales are now three times foreclosures, although that is related to the new foreclosure rules in Nevada. Both Phoenix and Sacramento had over twice as many short sales as foreclosures. A year ago, there were many more foreclosures than short sales in most areas. Minneapolis is an exception with more foreclosures than short sales.
2) The overall percent of distressed sales (combined foreclosures and short sales) are down year-over-year almost everywhere. Chicago is essentially unchanged from a year ago.
And previously from Lawler:
Note that the distressed sales shares in the below table are based on MLS data, and often based on certain “fields” or comments in the MLS files, and some have questioned the accuracy of the data. Some MLS/associations only report on overall “distressed” sales.
| Short Sales Share | Foreclosure Sales Share | Total "Distressed" Share | ||||
|---|---|---|---|---|---|---|
| 12-Sep | 11-Sep | 12-Sep | 11-Sep | 12-Sep | 11-Sep | |
| Las Vegas | 44.8% | 23.5% | 13.6% | 49.4% | 58.4% | 72.9% |
| Reno | 41.0% | 29.0% | 12.0% | 38.0% | 53.0% | 67.0% |
| Phoenix | 27.0% | 27.0% | 12.9% | 37.1% | 39.9% | 64.1% |
| Sacramento | 35.4% | 26.1% | 15.4% | 37.9% | 50.8% | 64.0% |
| Minneapolis | 10.1% | 13.1% | 25.2% | 32.9% | 35.3% | 46.0% |
| Mid-Atlantic (MRIS) | 12.4% | 12.6% | 9.4% | 14.4% | 21.8% | 27.0% |
| Orlando | 28.0% | 25.6% | 24.0% | 35.9% | 52.0% | 61.5% |
| California (DQ)* | 27.0% | 23.8% | 17.7% | 33.8% | 44.7% | 57.6% |
| California (CAR) | 24.3% | 21.0% | 12.3% | 27.5% | 37.0% | 48.7% |
| Lee County, FL*** | 21.4% | 21.4% | 15.9% | 31.5% | 37.3% | 52.9% |
| Colorado** | 6.5% | 6.1% | 12.3% | 19.8% | 18.7% | 25.8% |
| King Co. WA** | 16.0% | 10.0% | 10.0% | 22.0% | 25.0% | 32.0% |
| Hampton Roads VA | 25.4% | 31.6% | ||||
| Miami-Dade | 47.4% | 59.6% | ||||
| Northeast Florida | 44.7% | 49.0% | ||||
| Chicago | 40.6% | 40.0% | ||||
| Rhode Island | 23.9% | 28.9% | ||||
| Miami-Dade | 47.4% | 59.0% | ||||
| Charlotte | 15.3% | 20.9% | ||||
| Columbus OH** | 25.2% | 30.5% | ||||
| Memphis* | 26.3% | 30.8% | ||||
| Birmingham AL | 26.6% | 31.8% | ||||
| Houston | 16.1% | 19.4% | ||||
| *share of existing home sales, based on property records | ||||||
| **Third Quarter | ||||||
| *** SF only | ||||||
CoreLogic: House Price Index declined seasonally in September, Up 5.0% Year-over-year
by Calculated Risk on 11/06/2012 11:30:00 AM
Notes: This CoreLogic House Price Index report is for September. The recent Case-Shiller index release was for August. Case-Shiller is currently the most followed house price index, however CoreLogic is used by the Federal Reserve and is followed by many analysts. The CoreLogic HPI is a three month weighted average and is not seasonally adjusted (NSA).
From CoreLogic: CoreLogic® September Home Price Index Rises 5 Percent Year-Over-Year
Home prices nationwide, including distressed sales, increased on a year-over-year basis by 5 percent in September 2012 compared to September 2011. This change represents the biggest increase since July 2006 and the seventh consecutive increase in home prices nationally on a year-over-year basis. On a month-over-month basis, including distressed sales, home prices decreased by 0.3 percent in September 2012 compared to August 2012.
...
Excluding distressed sales, home prices nationwide also increased on a year-over-year basis by 5 percent in September 2012 compared to September 2011. On a month-over-month basis excluding distressed sales, home prices increased 0.5 percent in September 2012 compared to August 2012, the seventh consecutive month-over-month increase. Distressed sales include short sales and real estate owned (REO) transactions.
The CoreLogic Pending HPI indicates that October 2012 home prices, including distressed sales, are expected to rise by 5.7 percent on a year-over-year basis from October 2011 and fall by 0.5 percent on a month-over-month basis from September 2012 as sales exhibit a seasonal slowdown going into the winter.
...
“Home price improvement nationally continues to outpace our expectations, growing 5 percent year-over-year in September, the best showing since July 2006,” said Mark Fleming, chief economist for CoreLogic. “While prices on a month-over-month basis are declining, as expected in the housing off-season, most states are exhibiting price increases. Gains are particularly large in former housing bubble states and energy-industry concentrated states."
 Click on graph for larger image.
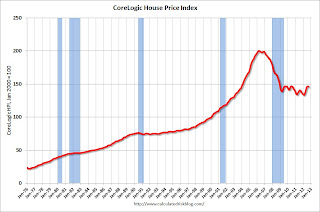
 This graph shows the national CoreLogic HPI data since 1976. January 2000 = 100.
The index was down 0.3% in September, and is up 5.0% over the last year.
The index is off 26.9% from the peak - and is up 9.7% from the post-bubble low set in February (the index is NSA, so some of the increase is seasonal).
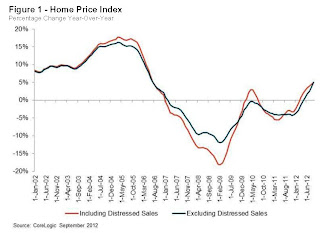
 The second graph is from CoreLogic. The year-over-year comparison has been positive for seven consecutive months suggesting house prices bottomed earlier this year on a national basis (the bump in 2010 was related to the tax credit).
This is the largest year-over-year increase since 2006.
Since this index is not seasonally adjusted, it was expected to decline on a month-to-month basis in September, and will probably stay negative on a month-to-month basis until the March 2013 report is released. The key for the next several months will be to watch the year-over-year change.


