by Calculated Risk on 11/11/2012 11:14:00 AM
Sunday, November 11, 2012
Sacramento October House Sales: Conventional Sales up 55% year-over-year
Note: I've been following the Sacramento market to look for changes in the mix of house sales in a distressed area over time (conventional, REOs, and short sales). The Sacramento Association of REALTORS® started breaking out REOs in May 2008, and short sales in June 2009.
Recently there has been a dramatic shift from REO to short sales, and the percentage of distressed sales has been declining. This data would suggest some improvement in the Sacramento market.
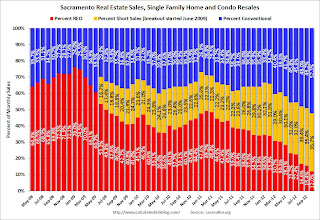
In October 2012, 47.7% of all resales (single family homes and condos) were distressed sales. This was down from 50.8% last month, and down from 64.1% in October 2011. The is the lowest percentage of distressed sales - and therefore the highest percentage of conventional sales - since the association started tracking the data.
The percentage of REOs fell to 12.0%, the lowest since the Sacramento Realtors started tracking the data and the percentage of short sales increased to 35.7%, the highest percentage recorded.
Here are the statistics.
 Click on graph for larger image.
This graph shows the percent of REO sales, short sales and conventional sales.
There has been an increase in conventional sales this year, and there were almost three times as many short sales as REO sales in October. The gap between short sales and REO sales is increasing.
Total sales were up 7% from October 2011, and conventional sales were up 55% compared to the same month last year. This is exactly what we expect to see in an improving distressed market - flat or even declining overall sales as distressed sales decline, but an increase in conventional sales.
Active Listing Inventory for single family homes declined 60.4% from last October, although listings were up 4% in October compared to the previous month.
Cash buyers accounted for 36.9% of all sales (frequently investors), and median prices were up 4.1% from last October.
This seems to be moving in the right direction, although the market is still in distress. We are seeing a similar pattern in other distressed areas to more conventional sales, and a shift from REO to short sales.
Chicago Fed Letter: "Detecting early signs of financial instability"
by Calculated Risk on 11/11/2012 09:09:00 AM
Here is another possible tool for predicting financial stress. From Scott Brave, senior business economist, and R. Andrew Butters, graduate student, Kellogg School of Management, Northwestern University: Detecting early signs of financial instability. A few excerpts:
Following the financial crisis, policymakers and researchers have sought to identify new indicators that may be useful in gauging the relationship between the financial and nonfinancial sectors of the economy in the hope of detecting early signs of financial instability. The ratio of private credit to gross domestic product (GDP) has received a lot of attention in this regard.1 This leverage ratio serves as an early warning indicator of financial instability, insofar as it captures instances where the nonfinancial sector’s financial obligations form an outsized share of the broader economy’s resources.
In this Chicago Fed Letter, we propose an alternative early warning indicator to the private-credit-to-GDP ratio. Our measure is constructed as a subindex made up of two nonfinancial leverage measures used in the Chicago Fed’s National Financial Conditions Index (NFCI). We show that this subindex has performed well as a leading indicator for historical periods of financial stress and their accompanying recessions in the United States; we also demonstrate that it has been more accurate than the private-credit-to-GDP ratio in predicting both at longer forecast horizons.
 Click on graph for larger image.
The solid black line is the nonfinancial leverage subindex of the Chicago Fed’s National Financial Conditions Index, and the solid blue line is the ratio of private credit to gross domestic product (GDP) detrended as explained in note 4. For ease of comparison, both measures have been scaled to have a mean of zero and a standard deviation of one over the period 1973–2012.And their conclusion:
The horizontal (time) axis is measured in weeks. We assign the quarterly private-credit-to-GDP ratio to the last week of each quarter to be able to plot it on the same figure panel as the weekly nonfinancial leverage subindex. The shaded regions in panel A correspond with historical periods of financial stress based on the analysis in Brave and Butters (2012).
The dashed black line is the two-year-ahead prediction threshold for a financial crisis (panel A) ... calculated for the nonfinancial leverage subindex, as explained in the text.
Our nonfinancial leverage indicator signals both the onset and duration of financial crises and their accompanying recessions more reliably at longer lead times than the private-credit-to-GDP ratio.This might be useful some time in the future. The Chicago Fed will include this as part of the NFCI release.
Beginning with the November 15, 2012, NFCI release, we will include the nonfinancial leverage subindex in the publicly available materials for the NFCI at www.chicagofed.org/nfci.
Saturday, November 10, 2012
Unofficial Problem Bank list declines to 860 Institutions
by Calculated Risk on 11/10/2012 05:11:00 PM
CR Note: The first unofficial problem bank list was published in August 2009 with 389 institutions. The number of unofficial problem banks grew steadily and peaked at 1,002 institutions on June 10, 2011. The list has been declining recently.
This is an unofficial list of Problem Banks compiled only from public sources.
Here is the unofficial problem bank list for Nov 9, 2012. (table is sortable by assets, state, etc.)
Changes and comments from surferdude808:
Only one action termination this week for the Unofficial Problem Bank List. The Federal Reserve terminated the Written Agreement against Community First Bank, Boscobel, WI ($217 million). After the change, the list holds 860 institutions with assets of $328.2 billion. A year ago, the list held 981 institutions with assets of $405.9 billion.Earlier:
Next week, activity should pick-up as the OCC will publish it actions through mid-October and perhaps the FDIC will execute a few closings to get ahead of the Thanksgiving Day holiday.
• Summary for Week Ending Nov 9th
• Schedule for Week of Nov 11th
Schedule for Week of Nov 11th
by Calculated Risk on 11/10/2012 01:10:00 PM
Earlier:
• Summary for Week Ending Nov 9th
Several economic reports this week will be impacted by Hurricane Sandy including retail sales, weekly unemployment claims, and the regional NY and Philly Fed manufacturing surveys.
The key report for the week is retail sales for October. For manufacturing, the November NY Fed (Empire state) and Philly Fed surveys, and the October Industrial Production and Capacity Utilization report will all be released this week.
On prices, CPI for October will be released on Thursday.
Also Fed Chairman Ben Bernanke speaks Thursday on "Housing and Mortgage Markets".
4:00 AM ET: Eurozone Finance Ministers Meeting
8:30 AM: Producer Price Index for October. The consensus is for a 0.1% increase in producer prices (0.1% increase in core).
 8:30 AM ET: Retail sales for October will be released. Note: Retail sales (especially auto sales) were impacted by Hurricane Sandy.
This graph shows retail sales since 1992. This is monthly retail sales and food service, seasonally adjusted (total and ex-gasoline). Retail sales are up 24.6% from the bottom, and now 9.0% above the pre-recession peak (not inflation adjusted)
The consensus is for retail sales to decrease 0.2% in October, and for retail sales ex-autos to increase 0.1%.
10:00 AM: Manufacturing and Trade: Inventories and Sales for September (Business inventories). The consensus is for 0.6% increase in inventories.
2:00 PM: FOMC Minutes for Meeting of October 23-24, 2012.
8:30 AM: Consumer Price Index for October. The consensus is for CPI to increase 0.1% in October and for core CPI to increase 0.1%.
8:30 AM: NY Fed Empire Manufacturing Survey for November. The consensus is for a reading of minus 9, down from minus 6.2 in October (below zero is contraction).
10:00 AM: Philly Fed Survey for November. The consensus is for a reading of minus 1.0, down from 5.7 last month (above zero indicates expansion).
1:20 PM: Speech, Fed Chairman Ben Bernanke, Housing and Mortgage Markets, At the HOPE Global Financial Dignity Summit, Atlanta, Georgia
 9:15 AM: The Fed will release Industrial Production and Capacity Utilization for October.
This shows industrial production since 1967.
The consensus is for no change in Industrial Production in October, and for Capacity Utilization to decrease to 78.2%.
Summary for Week Ending Nov 9th
by Calculated Risk on 11/10/2012 08:05:00 AM
The big event this week was the presidential election. For economic data, this was a pretty light week.
The key report was the trade deficit that showed exports increased more than imports in September, and the trade deficit declined. Also Consumer sentiment has increased to pre-recession levels.
Other data was a little weak: The ISM service index declined in October, and job openings declined in September.
Next week will be busier.
Here is a summary of last week in graphs:
• Trade Deficit declined in September to $41.5 Billion
 Click on graph for larger image.
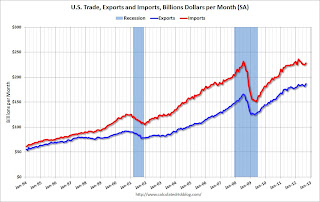
The first graph shows the monthly U.S. exports and imports in dollars through September 2012.
Both exports and imports increased in September. Exports are at a new high. The trade deficit was smaller than the consensus forecast of $45.4 billion.
Exports are 13% above the pre-recession peak and up 3.5% compared to September 2011; imports are 1% below the pre-recession peak, and up about 1.5% compared to September 2011.
 The second graph shows the U.S. trade deficit, with and without petroleum, through September.
The blue line is the total deficit, and the black line is the petroleum deficit, and the red line is the trade deficit ex-petroleum products.
Oil averaged $98.88 in September, up from $94.36 per barrel in August. The trade deficit with China increased to $29.1 billion in September, up from $28.0 billion in September 2011. Most of the trade deficit is due to oil and China.
This suggests a small upward revision to Q3 GDP.
• ISM Non-Manufacturing Index decreases in October
 The October ISM Non-manufacturing index was at 54.2%, down from 55.1% in September. The employment index increased in October to 54.9%, up from 51.1% in September. Note: Above 50 indicates expansion, below 50 contraction.
This graph shows the ISM non-manufacturing index (started in January 2008) and the ISM non-manufacturing employment diffusion index.
This was below the consensus forecast of 54.9% and indicates slower expansion in October than in September. The internals were mixed with the employment index up, but new orders down.
• BLS: Job Openings "essentially unchanged" in September, Up year-over-year
 This graph shows job openings (yellow line), hires (dark blue), Layoff, Discharges and other (red column), and Quits (light blue column) from the JOLTS.
Notice that hires (dark blue) and total separations (red and light blue columns stacked) are pretty close each month. This is a measure of turnover. When the blue line is above the two stacked columns, the economy is adding net jobs - when it is below the columns, the economy is losing jobs.
Jobs openings decreased in September to 3.561 million, down slightly from 3.661 million in August. The number of job openings (yellow) has generally been trending up, and openings are only up about 2% year-over-year compared to September 2011.
Quits decreased in September, and quits are down slightly year-over-year. These are voluntary separations. (see light blue columns at bottom of graph for trend for "quits").
• Weekly Initial Unemployment Claims decline to 355,000
 The DOL reported: "In the week ending November 3, the advance figure for seasonally adjusted initial claims was 355,000, a decrease of 8,000 from the previous week's unrevised figure of 363,000. The 4-week moving average was 370,500, an increase of 3,250 from the previous week's unrevised average of 367,250."
The dashed line on the graph is the current 4-week average. The four-week average of weekly unemployment claims increased to 370,500. This is about 7,000 above the cycle low for the 4-week average of 363,000 in March.
Mostly moving sideways this year, but near the cycle bottom.
SPECIAL NOTE: Due to Hurricane Sandy, we will probably see an increase in initial unemployment claims over the next few weeks. The decline this week was probably because some people in a few states - like New York and New Jersey - were not able to file claims immediately.
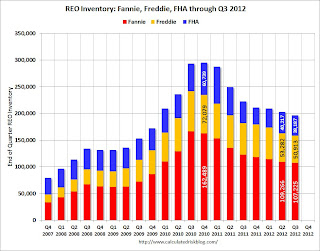
• Fannie, Freddie, FHA REO inventory declined in Q3
 This graph shows the REO inventory for Fannie, Freddie and the FHA (FHA for August). This was the seventh straight quarterly decline in the "F's" REO inventory, and total "F" REO was down 12% from a year ago.
 This is only a portion of the total REO. There is also REO for private-label MBS, FDIC-insured institutions, VA and more. REO has been declining for those categories too.
The second graph shows the same data with Private Label Securities added.
 From Tom Lawler:
 Here is a chart showing some history of SF REO holdings of Fannie, Freddie, FHA, and private-label securities (from Barclays Capital). Note that FHA has not yet released its report to the FHA commissioner for September (everything there may be focused on the FY 2012 Actuarial Review due out next week, which could be a doozy!), and the number for the end of Q3/2012 (38,187) is actually the August inventory number.
More from CR: When the FDIC's Q3 quarterly banking profile is released in a couple of weeks, I'm sure Tom will add an estimate for REO at FDIC-insured institutions. This is not all REO: In addition to the FDIC-insured institution REO, this excludes non-FHA government REO (VA, USDA, etc.), credit unions, finance companies, non-FDIC-insured banks and thrifts, and a few other categories.
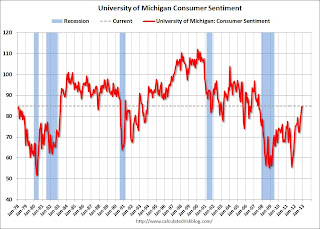
• Preliminary November Consumer Sentiment increases to 84.9
 The preliminary Reuters / University of Michigan consumer sentiment index for November increased to 84.9 from the October reading of 82.6. This was the highest level since July 2007 - before the recession started.
This was above the consensus forecast of 83.1. Overall sentiment is still somewhat weak - probably due to a combination of the high unemployment rate and the sluggish economy - but consumer sentiment has been improving recently.
However - remember - that sharp decline in sentiment in August 2011 was due to the threat of default and the debt ceiling debate. Hopefully we will not see that again early next year before the fiscal slope is resolved.


