by Calculated Risk on 11/16/2012 01:39:00 PM
Friday, November 16, 2012
FNC: Residential Property Values increased 2.3% year-over-year in September
In addition to Case-Shiller, CoreLogic, and LPS, I'm also watching the FNC, Zillow and several other house price indexes.
FNC released their September index data today. FNC reported that their Residential Price Index™ (RPI) indicates that U.S. residential property values were unchanged in September from August (Composite 100 index, not seasonally adjusted). The other RPIs (10-MSA, 20-MSA, 30-MSA) increased between 0.2% and 0.4% in September. These indexes are not seasonally adjusted (NSA), and are for non-distressed home sales (excluding foreclosure auction sales, REO sales, and short sales).
Since these indexes are NSA, the month-to-month changes will probably turn negative in October. The key is to watch the year-over-year change and also to compare the month-to-month change to previous years.
The year-over-year trends continued to show improvement in September, with the 100-MSA composite up 2.3% compared to September 2011. The FNC index turned positive on a year-over-year basis in July - that was the first year-over-year increase in the FNC index since year-over-year prices started declining in early 2007 (over five years ago).
 Click on graph for larger image.
This graph is based on the FNC index (four composites) through September 2012. The FNC indexes are hedonic price indexes using a blend of sold homes and real-time appraisals.
The key is the indexes are now showing a year-over-year increase.
The September Case-Shiller index will be released on Tuesday, November 27th.
2012 FHA Actuarial Review Press Release and Report
by Calculated Risk on 11/16/2012 12:22:00 PM
Note: Apparently the web release yesterday was accidental. Oops!
Here is the press release: FHA ISSUES ANNUAL FINANCIAL STATUS REPORT TO CONGRESS
The U.S. Department of Housing and Urban Development (HUD) today released its annual report to Congress on the financial condition of the Federal Housing Administration (FHA) Mutual Mortgage Insurance (MMI) Fund. In reporting on findings of the independent actuarial study, HUD indicates that while FHA continues to be impacted by losses from mortgages originated prior to 2009, this report does not directly affect the adequacy of capital balances in the MMI Fund.On earlier loans and DAPs (DAPs were a hot topic on this blog from early 2005 until they were banned):
The independent study found that as the housing market continues to recover, the capital reserve ratio of the MMI Fund used to support FHA’s single family mortgage and reverse mortgage insurance programs fell below zero to -1.44 percent. This represents a negative economic value of $16.3 billion. This does not mean FHA has insufficient cash to pay insurance claims, a current operating deficit, or will need to immediately draw funds from the Treasury. The need to draw on Treasury funds is determined not by the economic assumptions of this actuarial review but those used in the President’s FY 2014 budget proposal to be released in February, with a final determination on a potential draw made in September. Also, the actuary’s estimate of the Fund’s economic value excludes $11 billion in expected capital accumulation through the end of FY 2013. Finally, HUD’s report includes additional actions designed to contribute billions of dollars in added value to the MMI Fund over the next several years.
...
Three factors are driving the change in FHA’s position compared to last year:
First, the house-price appreciation forecasts used for this actuarial review are significantly lower than those used in last year’s report, as the actual turnaround in the housing market occurred later than was projected last year. These house-price appreciation estimates do not include improvements to home prices that occurred since June and were depressed by a high level of refinance activity.
Second, the continued decline in interest rates, while good for the overall economy, costs the FHA revenue as its borrowers pay off their mortgages to refinance into lower rates. Again, this is clearly a positive, but it impacts the actuary’s estimate of the value of the Fund. In addition, the actuary predicts that borrowers with higher interest rates who are unable to refinance will default at higher than normal rates, increasing losses from foreclosures for FHA.
Third, based on recommendations made by the Government Accountability Office (GAO), HUD’s Inspector General and others, FHA directed the actuary to employ a refined methodology this year to more precisely predict the way losses from defaulted loans and reverse mortgages are reflected in the economic value of the MMI Fund.
Losses on loans insured between Fiscal Years 2007 and 2009 continue to place a significant strain on the Fund with $70 billion in FHA claims attributable to loans insured in those years. Though they were prohibited in 2009, the ongoing effect of “seller-funded downpayment assistance loans” is still significant. The net expected cost of those loans, as projected by the independent actuaries, is more than $15 billion. By contrast, the actuary found that the FHA’s books of business since FY2010 are expected to be very beneficial, providing billions of dollars in net revenues to offset losses on earlier books.The FHA had a very low market share in 2005 and 2006, but many of those insured loans were "seller-funded downpayment assistance loans" - and those loans performed horribly (as expected with no money down and buying at the peak).
Mortgage Delinquencies by Loan Type in Q3
by Calculated Risk on 11/16/2012 11:25:00 AM
The following graphs show the percent of loans delinquent by loan type based on the MBA National Delinquency Survey: Prime, Subprime, FHA and VA. First a table comparing the number of loans in Q2 2007 and Q3 2012 so readers can understand the shift in loan types.
Both the number of prime and subprime loans have declined over the last five years; the number of subprime loans is down by about 32%. Meanwhile the number of FHA loans has more than doubled and VA loans have increased sharply.
Note: There are about 41.8 million first-lien loans in the survey, and the MBA survey is about 88% of the total. In the MBA universe, there are under 600 thousand seriously delinquent FHA loans. However, in the entire market, according to the FHA, there are over 700 thousand seriously delinquent FHA loans.
For Prime and Subprime, a majority of the seriously delinquent loans were originated in the 2005 to 2007 period - and these loans are still in the process of being resolved through foreclosure or short sales. However, for the FHA, about 45% of the seriously delinquent loans were originated in 2008 and 2009. That is the period when private capital disappeared, and the FHA share of the market increased sharply.
Luckily the FHA had a small market share in 2005 and 2006; however they did make quite a few bad loans in that period because of seller financed Downpayment Assistance Programs (DAPs). These were programs that allowed the seller to give the buyer the downpayment through a 3rd party "charity" (for a fee of course). The buyer had no money in the house and the default rates were absolutely horrible. (The DAPs were finally eliminated in late 2008).
| MBA National Delinquency Survey Loan Count | ||||
|---|---|---|---|---|
| Q2 2007 | Q3 2012 | Change | Q3 2012 Seriously Delinquent | |
| Prime | 33,916,830 | 29,242,787 | -4,674,043 | 1,371,487 |
| Subprime | 6,204,535 | 4,207,315 | -1,997,220 | 914,670 |
| FHA | 3,030,214 | 6,770,134 | 3,739,920 | 578,169 |
| VA | 1,096,450 | 1,553,812 | 457,362 | 68,989 |
| Survey Total | 44,248,029 | 41,774,048 | -2,473,981 | 2,933,316 |
 Click on graph for larger image.
First a repeat: This graph shows the percent of loans delinquent by days past due. Loans 30 days delinquent increased to 3.25% from 3.18% in Q2. This is just above 2007 levels and around the long term average.
Delinquent loans in the 60 day bucket decreased to 1.19% in Q3, from 1.22% in Q2.
The 90 day bucket decreased to 2.96% from 3.19%. This is still way above normal (around 0.8% would be normal according to the MBA).
The percent of loans in the foreclosure process decreased to 4.07% from 4.27% and is now at the lowest level since Q1 2009.
Note: Scale changes for each of the following graphs.
 The second graph is for all prime loans.
 This is the category with the most seriously delinquent loans. Back in early 2007 when Fed Chairman Ben Bernanke said "the problems in the subprime market seems likely to be contained", my former co-blogger Tanta responded "We are all subprime!" - she was correct.
Since there are far more prime loans than any other category (see table above), about 47% of the loans seriously delinquent now are prime loans - even though the overall delinquency rate is much lower than other loan types.
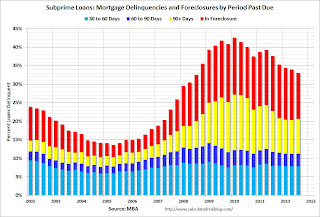
 This graph is for subprime. This category gets most of the attention - mostly because of all the terrible loans made through the Wall Street "originate-to-distribute" model and sold as Private Label Securities (PLS). Not all PLS was subprime, but the worst of the worst loans were packaged in PLS.
Although the delinquency rate is still very high, the number of subprime loans has declined sharply.
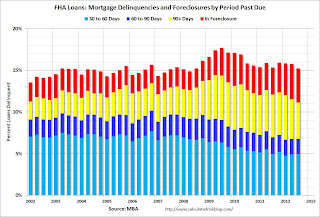
 This graph is for FHA loans. It might surprise people, but the percent of FHA delinquent loans (not including in foreclosure) is at the lowest level in a decade. That is because the recently originated loans (2010 through 2012) are performing very well, and the FHA originated a large number of loans in that period.
Of course there are still a large number of loans in the foreclosure process, and the remaining DAPs and the loans originated in 2008 and 2009 are performing poorly.
 The last graph is for VA loans. This is a fairly small but growing category (see table above).
The good news is every category is improving. There are still quite a few subprime loans that are in distress, but the real keys going forward are prime loans and FHA loans.
Industrial Production decreased 0.4% in October due to Hurricane Sandy, Capacity Utilization decreased
by Calculated Risk on 11/16/2012 09:15:00 AM
From the Fed: Industrial production and Capacity Utilization
Industrial production declined 0.4 percent in October after having increased 0.2 percent in September. Hurricane Sandy, which held down production in the Northeast region at the end of October, is estimated to have reduced the rate of change in total output by nearly 1 percentage point. The largest estimated storm-related effects included reductions in the output of utilities, of chemicals, of food, of transportation equipment, and of computers and electronic products. In October, the index for manufacturing decreased 0.9 percent; excluding storm-related effects, factory output was roughly unchanged from September. The output of utilities edged down 0.1 percent in October, and production at mines advanced 1.5 percent. At 96.6 percent of its 2007 average, total industrial production in October was 1.7 percent above its year-earlier level. Capacity utilization for total industry decreased 0.4 percentage point to 77.8 percent, a rate 2.5 percentage points below its long-run (1972--2011) average.
emphasis added
 Click on graph for larger image.
This graph shows Capacity Utilization. This series is up 10.9 percentage points from the record low set in June 2009 (the series starts in 1967).
Capacity utilization at 77.8% is still 2.5 percentage points below its average from 1972 to 2010 and below the pre-recession level of 80.6% in December 2007.
Note: y-axis doesn't start at zero to better show the change.
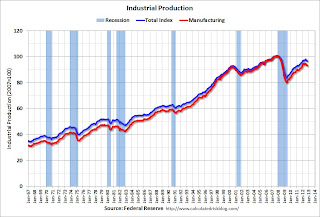
 The second graph shows industrial production since 1967.
Industrial production decreased in October to 96.6. This is 15% above the recession low, but still 4.1% below the pre-recession peak.
IP was slightly below expectations due to the impact of Hurricane Sandy. We will probably see some bounce back over the next couple of months.
Thursday, November 15, 2012
Friday: Industrial Production and Capacity Utilization
by Calculated Risk on 11/15/2012 09:18:00 PM
Note: The report linked to in 2012 FHA Actuarial Review Released: Negative $13.5 Billion economic value appears to have been taken down (maybe released early by mistake). Nick Timiraos at the WSJ writes: Report: FHA to Exhaust Capital Reserves
[T]he latest forecasts show that while the FHA currently has reserves of $30.4 billion, it expects to lose $46.7 billion on the loans it has guaranteed, resulting in a $16.3 billion deficit.Friday:
...
"If [the FHA] were a private company, it would be declared insolvent and probably put under conservatorship like Fannie and Freddie," said Thomas Lawler, an independent housing economist in Leesburg, Va.
...
Overall, the FHA insured nearly 739,000 loans that were 90 days or more past due or in foreclosure at the end of September, an increase of more than 100,000 loans from a year ago. That represents about 9.6% of all insured loans.
Most of the agency's losses stem from loans made between 2007 and 2009, as the housing bust deepened. Loans made since 2010 are expected to be very profitable.
• At 9:15 AM ET, the Fed will release Industrial Production and Capacity Utilization for October. The consensus is for 0.2% increase in Industrial Production in October, and for Capacity Utilization to increase to 78.4%.
Another question for the November economic prediction contest (Note: You can now use Facebook, Twitter, or OpenID to log in).


