by Calculated Risk on 11/20/2012 11:05:00 AM
Tuesday, November 20, 2012
State Unemployment Rates decreased in 37 States in October
From the BLS: Regional and State Employment and Unemployment Summary
Regional and state unemployment rates were little changed in October. Thirty-seven states and the District of Columbia recorded unemployment rate decreases, seven states posted rate increases, and six states had no change, the U.S. Bureau of Labor Statistics reported today.
...
Nevada continued to record the highest unemployment rate among the states, 11.5 percent in October. Rhode Island and California posted the next highest rates, 10.4 and 10.1 percent, respectively. North Dakota again registered the lowest jobless rate, 3.1 percent.
 Click on graph for larger image in graph gallery.
This graph shows the current unemployment rate for each state (red), and the max during the recession (blue). All states are below the maximum unemployment rate for the recession.
The size of the blue bar indicates the amount of improvement - Michigan and Ohio have seen the most improvement - New Jersey, Connecticut and New York are the laggards.
The states are ranked by the highest current unemployment rate. Only three states still have double digit unemployment rates: Nevada, Rhode Island, and California. In early 2010, 18 states and D.C. had double digit unemployment rates.
I expect the unemployment rate in California to fall below 10% very soon, although New Jersey might hit double digits because of Hurricane Sandy.
Earlier on Housing Starts:
• Housing Starts increased to 894 thousand SAAR in October
• Starts and Completions: Multi-family and Single Family
• All Housing Investment and Construction Graphs
Starts and Completions: Multi-family and Single Family
by Calculated Risk on 11/20/2012 09:56:00 AM
Ten months of the way through 2012, single family starts are on pace for about 530 thousand this year, and total starts are on pace for about 770 thousand. That is an increase of over 20% from 2011.
The following table shows annual starts (total and single family) since 2005 and an estimate for 2012.
| Housing Starts (000s) | ||||
|---|---|---|---|---|
| Total | Change | Single Family | Change | |
| 2005 | 2,068.3 | --- | 1,715.8 | --- |
| 2006 | 1,800.9 | -12.9% | 1,465.4 | -14.6% |
| 2007 | 1,355.0 | -24.8% | 1,046.0 | -28.6% |
| 2008 | 905.5 | -33.2% | 622.0 | -40.5% |
| 2009 | 554.0 | -38.8% | 445.1 | -28.4% |
| 2010 | 586.9 | 5.9% | 471.2 | 5.9% |
| 2011 | 608.8 | 3.7% | 430.6 | -8.6% |
| 20121 | 770.0 | 26% | 530.0 | 23% |
| 12012 estimated | ||||
And the growth in housing starts should continue over the next few years. Even with the significant increase this year, starts in 2012 will still be the 4th lowest year since the Census Bureau started tracking starts in 1959 (the three lowest years were 2009 through 2011).
My estimate is the US will probably add around 12 million households this decade, and if there was no excess supply, total housing starts would be 1.2 million per year, plus demolitions, plus 2nd home purchases. So housing starts could come close to doubling the 2012 level over the next several years - and that is one of the key reasons I think the US economy will continue to grow.
Here is an update to the graph comparing multi-family starts and completions. Since it usually takes over a year on average to complete a multi-family project, there is a lag between multi-family starts and completions. Completions are important because that is new supply added to the market, and starts are important because that is future new supply (units under construction is also important for employment).
These graphs use a 12 month rolling total for NSA starts and completions.
 Click on graph for larger image.
The blue line is for multifamily starts and the red line is for multifamily completions.
The rolling 12 month total for starts (blue line) has been increasing steadily, and completions (red line) is lagging behind - but completions will follow starts up (completions lag starts by about 12 months).
This means there will be an increase in multi-family deliveries next year, but still well below the 1997 through 2007 level of multi-family completions.
 The second graph shows single family starts and completions. It usually only takes about 6 months between starting a single family home and completion - so the lines are much closer. The blue line is for single family starts and the red line is for single family completions.
Starts are moving up, but the increase in completions has just started. Usually single family starts bounce back quickly after a recession, but not this time because of the large overhang of existing housing units. The "wide bottom" was what I was forecasting several years ago, and now I expect several years of increasing single family starts and completions.
Housing Starts increased to 894 thousand SAAR in October
by Calculated Risk on 11/20/2012 08:30:00 AM
From the Census Bureau: Permits, Starts and Completions
Housing Starts:
Privately-owned housing starts in October were at a seasonally adjusted annual rate of 894,000. This is 3.6 percent above the revised September estimate of 863,000 and is 41.9 percent above the October 2011 rate of 630,000.
Single-family housing starts in October were at a rate of 594,000; this is 0.2 percent below the revised September figure of 595,000. The October rate for units in buildings with five units or more was 285,000.
Building Permits:
Privately-owned housing units authorized by building permits in October were at a seasonally adjusted annual rate of 866,000. This is 2.7 percent below the revised September rate of 890,000, but is 29.8 percent above the October 2011 estimate of 667,000.
Single-family authorizations in October were at a rate of 562,000; this is 2.2 percent above the revised September figure of 550,000. Authorizations of units in buildings with five units or more were at a rate of 280,000 in October.
 Click on graph for larger image.
The first graph shows single and multi-family housing starts for the last several years.
Total housing starts were at 894 thousand (SAAR) in October, up 3.6% from the revised September rate of 863 thousand (SAAR). Note that September was revised down from 872 thousand.
Single-family starts decreased slightly to 594 thousand in October.
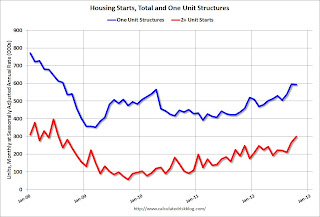
The second graph shows total and single unit starts since 1968.
 This shows the huge collapse following the housing bubble, and that total housing starts have been increasing lately after moving sideways for about two years and a half years.
 Total starts are up about 87% from the bottom start rate, and single family starts are up about 70% from the low.
This was above expectations of 840 thousand starts in October. This was mostly because of the volatile multi-family sector that increased sharply in October. However single family starts have increased recently too. Right now starts are on pace to be up about 25% from 2011. I'll have more soon ...
Monday, November 19, 2012
Tuesday: Housing Starts, Bernanke on Economy and Policy
by Calculated Risk on 11/19/2012 09:06:00 PM
Tuesday:
• At 8:30 AM, the Census Bureau will release Housing Starts for October. The consensus is for total housing starts to decline to 840,000 (SAAR) in October, down from 872,000 in September. Goldman Sachs is forecasting a decline in starts to 840,000, and Merrill Lynch is forecasting 815,000.
• At 10:00 AM, the BLS will release the Regional and State Employment and Unemployment report for October 2012.
• At 12:15 PM, Fed Chairman Ben Bernanke will speak at the Economic Club of New York, New York, New York, The Economic Recovery and Economic Policy. Bernanke will most likely avoid specific policies, but urge policymakers to put the budget on a "sustainable long-run path" and "to avoid unnecessarily impeding the current economic recovery".
Both quotes are from a speech Bernanke gave in June when he also said: "Fortunately, avoiding the fiscal cliff and achieving long-term fiscal sustainability are fully compatible and mutually reinforcing objectives. Preventing a sudden and severe contraction in fiscal policy will support the transition back to full employment, which should aid long-term fiscal sustainability. At the same time, a credible fiscal plan to put the federal budget on a longer-run sustainable path could help keep longer-term interest rates low and improve household and business confidence, thereby supporting improved economic performance today."
Earlier on Existing Home Sales:
• Existing Home Sales in October: 4.79 million SAAR, 5.4 months of supply
• Existing Home Sales: A Solid Report
• Existing Home Sales: The Increase in Conventional Sales
• Existing Home Sales graphs
Another question for the November economic prediction contest (Note: You can now use Facebook, Twitter, or OpenID to log in).
Existing Home Sales: The Increase in Conventional Sales
by Calculated Risk on 11/19/2012 06:40:00 PM
Earlier I pointed out that one the keys for housing to return to "normal" are more conventional sales and fewer distressed sales. Not all areas report the percentage of distressed sales, and the NAR uses an unscientific survey to estimate distressed sales.
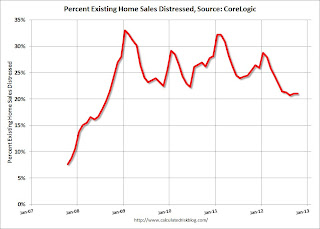
CoreLogic estimates the percent of distressed sales each month, and they were kind enough to send me their series. The first graph below shows CoreLogic's estimate of the distressed share starting in October 2007.
 Click on graph for larger image.
Note that the percent distressed increases every winter. This is because distressed sales happen all year, and conventional sales follow the normal seasonal pattern of stronger in the spring and summer, and weaker in the winter.
This is why the Case-Shiller seasonal adjustment increased in recent years.
Also note that the percent of distressed sales over the last 5 months is at the lowest level since mid-2008, but still very high.
The second graph shows the NAR existing home series using the CoreLogic share of distressed sales.
 If we just look at conventional sales (blue), sales declined from over 7 million in 2005 (graph starts in 2007) to a low of under 2.5 million.
Using this method (NAR estimate for sales, CoreLogic estimate of share), conventional sales are now back up to around 3.8 million SAAR. The NAR reported total sales were up 10.9% year-over-year in October, but using this method, conventional sales were up almost 18% year-over-year.
Earlier:
• Existing Home Sales in October: 4.79 million SAAR, 5.4 months of supply
• Existing Home Sales: A Solid Report
• Existing Home Sales graphs


