by Calculated Risk on 12/29/2012 05:13:00 PM
Saturday, December 29, 2012
Unofficial Problem Bank list declines to 838 Institutions
This is an unofficial list of Problem Banks compiled only from public sources.
Here is the unofficial problem bank list for Dec 28, 2012.
Changes and comments from surferdude808:
The FDIC released its enforcement action activity for November 2012 this week. As a result, seven banks were removed and four banks were added. The changes leave the Unofficial Problem Bank List with 838 institutions with assets of $313.1 billion. A year ago, the list held 970 institutions with assets of $391.2 billion. For the month, the list count declined by 18 and assets fell $13.3 billion. The count decline of 18 matches the highest amount recorded back in April 2012.
The FDIC terminated actions against County Bank, Rehoboth Beach, DE ($341 million); Citizens State Bank - Midwest, Cavalier, ND ($109 million); Prime Alliance Bank, Woods Cross, UT ($104 million); Holbrook Co-operative Bank, Holbrook, MA ($94 million); and Security State Bank of Lewiston, Lewiston, MN ($66 million). The other removals were Hastings State Bank, Hastings, NE, ($136 million) and Hull Federal Savings Bank, Baltimore, MD ($25 million) as they found merger partners.
The following four banks joined the list -- Lake Area Bank, Lindstrom, MN ($276 million); The Peoples Bank, Chestertown, MD ($247 million); WestSide Bank, Hiram, GA ($134 million); and First State Bank of Miami, Texas, Miami, TX ($50 million). The FDIC issued a Prompt Corrective Action order against Covenant Bank, Chicago, IL ($60 million).
After the passage of the fourth quarter, it is time for a refresh of the transition matrix. As seen in the table, there have been a total of 1,606 institutions with assets of $808.9 billion that have appeared on the list. Removals have totaled 768 institutions or nearly 48 percent of the total. Failures continue to be the leading removal cause as 347 institutions with assets of $290.4 billion have failed since appearing on the list. Removals from unassisted mergers and voluntary liquidations total 129 institutions. While there has been an acceleration in action terminations in 2012, the pace has slowed down some during the fourth quarter. In all, actions have been terminated against 292 institutions with assets of $129.6 billion, with 40 terminations occurring in this quarter.
| Unofficial Problem Bank List | |||
|---|---|---|---|
| Change Summary | |||
| Number of Institutions | Assets ($Thousands) | ||
| Start (8/7/2009) | 389 | 276,313,429 | |
| Subtractions | |||
| Action Terminated | 97 | (27,057,010) | |
| Unassisted Merger | 26 | (4,191,282) | |
| Voluntary Liquidation | 2 | (4,855,164) | |
| Failures | 148 | (182,228,947) | |
| Asset Change | (15,385,341) | ||
| Still on List at 12/28/2012 | 116 | 42,595,685 | |
| Additions | 722 | 270,521,747 | |
| End (12/28/2012) | 838 | 313,117,432 | |
| Intraperiod Deletions1 | |||
| Action Terminated | 195 | 102,513,931 | |
| Unassisted Merger | 94 | 49,619,506 | |
| Voluntary Liquidation | 7 | 1,760,816 | |
| Failures | 199 | 108,189,630 | |
| Total | 495 | 262,083,883 | |
| 1Institution not on 8/7/2009 or 12/28/2012 list but appeared on a weekly list. | |||
Earlier:
• Summary for Week Ending Dec 28th
• Schedule for Week of Dec 30th
Schedule for Week of Dec 30th
by Calculated Risk on 12/29/2012 01:11:00 PM
Earlier:
• Summary for Week Ending Dec 28th
The key report next week is the December employment report to be released on Friday. Other key reports include December auto sales on Wednesday, the December ISM manufacturing index, and the December ISM service index.
Reis might release their Q4 Office, Mall and Apartment vacancy rate reports this week.
Happy New Year to All! As usual, the Calculated Risk blog will be open all week.
10:30 AM: Dallas Fed Manufacturing Survey for December. This is the last of the regional surveys for December. The consensus is an increase to 1.0 from -2.8 in November (above zero is expansion).
SIFMA recommends US markets close at 2:00 PM ET in advance of the New Year’s Day holiday.
Happy New Year! US markets are closed in observance of the New Year’s Day holiday.
9:00 AM: The Markit US PMI Manufacturing Index. The consensus is for an increase to 54.2, up from 52.8.
 10:00 AM ET: ISM Manufacturing Index for December.
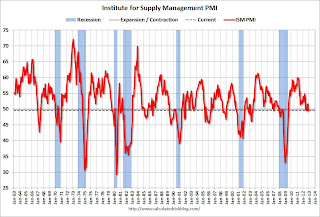
 Here is a long term graph of the ISM manufacturing index. The ISM manufacturing index indicated contraction in November. The was at 49.5% in November, down from 51.7% in October. The employment index was at 48.4%, down from 52.1%, and the new orders index was at 50.3%, down from 54.2%. The consensus is for PMI to increase to 50.5. (above 50 is expansion).
10:00 AM: Construction Spending for November. The consensus is for a 0.6% increase in construction spending.
7:00 AM: The Mortgage Bankers Association (MBA) will release two weeks of results for the mortgage purchase applications index this week.
8:15 AM: The ADP Employment Report for December. This report is for private payrolls only (no government). The consensus is for 150,000 payroll jobs added in December. This is the third report using the new methodology, and the report last month (118,000) was somewhat close to the BLS report for private employment (the BLS reported 147,000 private sector jobs added in November).
8:30 AM: The initial weekly unemployment claims report will be released. The consensus is for claims to increase to 363 thousand from 350 thousand last week.
10:00 AM: Trulia Price Rent Monitors for December. This is the index from Trulia that uses asking prices adjusted both for the mix of homes listed for sale and for seasonal factors.
2:00 PM: FOMC Minutes for Meeting of December 11-12, 2012. This will provide a little more details on the decision of the Fed to set thresholds for inflation and the unemployment rate.
All day: Light vehicle sales for December. The consensus is for light vehicle sales to decrease to 15.1 million SAAR in December (Seasonally Adjusted Annual Rate) from 15.5 million in November.
 This graph shows light vehicle sales since the BEA started keeping data in 1967. The dashed line is the November sales rate. Sales in November were boosted by some bounce back following Hurricane Sandy.
TrueCar is forecasting:
The December 2012 forecast translates into a Seasonally Adjusted Annualized Rate (“SAAR”) of 15.6 million new car sales, up from 13.6 million in December 2011 and up from 15.5 million in November 2012Edmunds.com is forecasting:
... an estimated Seasonally Adjusted Annual Rate (SAAR) this month of 15.4 million light vehicles
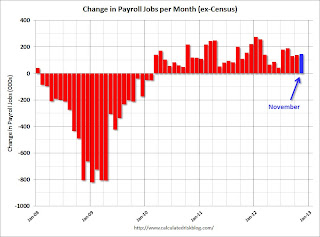
 8:30 AM: Employment Report for December. The consensus is for an increase of 157,000 non-farm payroll jobs in December; there were 146,000 jobs added in November.
 The consensus is for the unemployment rate to increase to 7.8% in December, up from 7.7% in November.
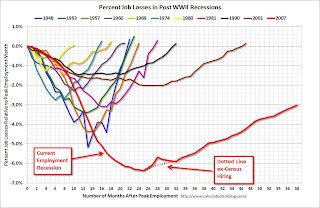
The second employment graph shows the percentage of payroll jobs lost during post WWII recessions through November.
 The economy has added 5.6 million private sector jobs since employment bottomed in February 2010 including preliminary benchmark revision (5.0 million total jobs added including all the public sector layoffs).
There are still 3.3 million fewer private sector jobs now than when the recession started in 2007 (including benchmark revision).
10:00 AM: Manufacturers' Shipments, Inventories and Orders (Factory Orders) for November. The consensus is for a 0.3% increase in orders.
10:00 AM: ISM non-Manufacturing Index for December. The consensus is for a decrease to 54.5 from 54.7 in November. Note: Above 50 indicates expansion, below 50 contraction.
3:30 PM: Speech by Fed Vice Chair Janet Yellen, "Systemic Risk", At the American Economic Association/American Finance Association Joint Luncheon, San Diego, California
Summary for Week ending Dec 28th
by Calculated Risk on 12/29/2012 08:03:00 AM
It was a light holiday week for economic data. Happy Holidays to all!
New home sales increased to 377,000 in November and are on pace to increase 18%+ in 2012. This was a solid annual increase, and yet sales are still very weak - 2012 will be the 3rd lowest year for New Home sales since the Census Bureau started tracking new home sales in 1963. So there is still plenty of upside for new home sales over the next few years.
Case-Shiller house prices were up 4.3% year-over-year in October, and will probably be up around 6% for the year. And the 4-week average of initial weekly unemployment claims declined to the lowest level of the year - and the lowest since early 2008.
Consumer confidence was weak (future expectations), and there were some reports of retail sales being below expectations, but overall the data was decent.
Of course the economic headlines were about the "fiscal cliff" negotiations. There is no cliff (more of a slope), and there is no drop dead date - but policymakers do need to reach an agreement soon.
Here is a summary of last week in graphs:
• New Home Sales at 377,000 SAAR in November
 Click on graph for larger image in graph gallery.
The Census Bureau reports New Home Sales in November were at a seasonally adjusted annual rate (SAAR) of 377 thousand. This was up from a revised 361 thousand SAAR in October (revised down from 368 thousand). Sales for August and September were revised up slightly.
The first graph shows New Home Sales vs. recessions since 1963. The dashed line is the current sales rate.
On inventory, according to the Census Bureau:
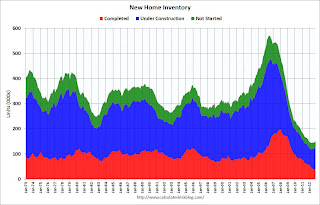
"A house is considered for sale when a permit to build has been issued in permit-issuing places or work has begun on the footings or foundation in nonpermit areas and a sales contract has not been signed nor a deposit accepted."Starting in 1973 the Census Bureau broke this down into three categories: Not Started, Under Construction, and Completed.
 This graph shows the three categories of inventory starting in 1973.
The inventory of completed homes for sale was just above the record low in November. The combined total of completed and under construction is also just above the record low since "under construction" is starting to increase.
New home sales have averaged 363 thousand SAAR through November 2012, up sharply from the 307 thousand sales in 2011. Also sales are finally at the lows for previous recessions too.
This was slightly above expectations of 375,000.
• Case-Shiller: House Prices increased 4.3% year-over-year in October
 The first graph shows the nominal seasonally adjusted Composite 10 and Composite 20 indices (the Composite 20 was started in January 2000).
The Composite 10 index is off 31.0% from the peak, and up 0.6% in October (SA). The Composite 10 is up 4.8% from the post bubble low set in March (SA).
The Composite 20 index is off 30.3% from the peak, and up 0.7% (SA) in October. The Composite 20 is up 5.4% from the post-bubble low set in March (SA).
 The second graph shows the Year over year change in both indices.
The Composite 10 SA is up 3.4% compared to October 2011.
The Composite 20 SA is up 4.3% compared to October 2011. This was the fifth consecutive month with a year-over-year gain since 2010 (when the tax credit boosted prices temporarily).
The third graph shows the price declines from the peak for each city included in S&P/Case-Shiller indices.
 Prices increased (SA) in 17 of the 20 Case-Shiller cities in October seasonally adjusted (also 12 of 20 cities increased NSA). Prices in Las Vegas are off 58.0% from the peak, and prices in Dallas only off 4.6% from the peak. Note that the red column (cumulative decline through October 2012) is above previous declines for all cities.
This was slightly above the consensus forecast for a 4.1% YoY increase.
• Real House Prices, and Price-to-Rent Ratio
Case-Shiller, CoreLogic and others report nominal house prices, and it is also useful to look at house prices in real terms (adjusted for inflation) and as a price-to-rent ratio.
 The graph shows the quarterly Case-Shiller National Index SA (through Q3 2012), and the monthly Case-Shiller Composite 20 SA and CoreLogic House Price Indexes in real terms (adjusted for inflation using CPI less Shelter). Note: some people use other inflation measures to adjust for real prices.
In real terms, the National index is back to mid-1999 levels, the Composite 20 index is back to July 2000, and the CoreLogic index back to January 2001.
In real terms, most of the appreciation in the last decade is gone.
In October 2004, Fed economist John Krainer and researcher Chishen Wei wrote a Fed letter on price to rent ratios: House Prices and Fundamental Value. Kainer and Wei presented a price-to-rent ratio using the OFHEO house price index and the Owners' Equivalent Rent (OER) from the BLS.
 Here is a similar graph using the Case-Shiller National, Composite 20 and CoreLogic House Price Indexes.
This graph shows the price to rent ratio (January 1998 = 1.0).
On a price-to-rent basis, the Case-Shiller National index is back to Q3 1999 levels, the Composite 20 index is back to August 2000 levels, and the CoreLogic index is back to February 2001.
In real terms - and as a price-to-rent ratio - prices are mostly back to 1999 or early 2000 levels.
• Weekly Initial Unemployment Claims decline to 350,000, 4-Week average at low for 2012

This graph shows the 4-week moving average of weekly claims since January 2000.
The dashed line on the graph is the current 4-week average. The four-week average of weekly unemployment claims declined to 356,750.
The 4-week average is now at the low for the year. The previous low for the 4-week average was 363,000.
The recent spike in the 4-week average was due to Hurricane Sandy.
Weekly claims were lower than the 365,000 consensus forecast.
Friday, December 28, 2012
Update on Fiscal Cliff
by Calculated Risk on 12/28/2012 08:40:00 PM
From a Goldman Sachs research note today:
Q: Where do things stand now?And comments from a WSJ article: Cliff Deal Hinges on Senators
A: Talks have resumed, but as of this writing there is no agreement yet. President Obama and congressional leaders met this afternoon to discuss the possible next steps that might be taken to avoid the fiscal restraint set to take effect at year-end. It seems likely that Senate Majority Leader Reid (D-NV) will bring up legislation on the Senate floor at some point before the end of the year, but it is not yet clear whether that will be the product of a bipartisan compromise reached with Republican leaders and the President, which would have a chance of passing both chambers of Congress, or a proposal supported only by Democrats, which would be less likely to pass in either chamber, particularly the House.
Q: Will there be an agreement by year-end?
A: It is still possible but a retroactive deal in January looks more likely. With little time left before year end, there are two obvious obstacles to enacting an agreement by that time: the lack of a political agreement, and the short time left on the calendar to get any agreement that might be reached enacted into law. Reaching a political agreement is the tougher part. ...
Q: If an agreement is reached, what would it look like?
A: Probably a scaled-down deal. At this point, the most likely solution prior to year end (or in the first few days of 2013) would be enactment of a scaled-down agreement that addresses only the policy changes scheduled for year-end and leaves for later other issues, such as an increase in the debt limit or longer-term fiscal reforms. This might involve an extension of the 2001/2003 tax cuts for income under $400,000 or $500,000 (including capital gains and dividend tax rates at 15% for taxpayers with income under that level and a 20% rate above), relief from the alternative minimum tax (AMT) for 2012, and extension of emergency unemployment benefits, which are scheduled to expire at year end.
"We had a good meeting down at the White House and we are engaged in discussions…in the hopes that we can come forward as early as Sunday" with a plan, said Senate Minority Leader Mitch McConnell (R., Ky.). "We'll be working hard to try to see if we can get there in the next 24 hours," he said, adding he was "hopeful and optimistic."There is some chance a deal will be announced this weekend, but it will not be a big deal if it slips into early January.
Senate Majority Leader Harry Reid (D., Nev.) agreed the meeting was "constructive." In a warning that seemed aimed at lawmakers in both parties, he said, "whatever we come up with is going to be imperfect."
Mr. Obama said Messrs. McConnell and Reid have the weekend to reach and pass a deal.
The Bubble in "Cliffs"
by Calculated Risk on 12/28/2012 05:49:00 PM
Just an observation ... I think we are seeing a "bubble" in "cliffs" ...
From CNBC: Milk Futures Showing No Sign of 'Dairy Cliff'
From CNBC: 'Container Cliff' Avoided Until Early February
This reminds of the bubble in bubble reporting following the housing bubble. Oh well ... it isn't as dumb as the "Risk on, risk off" meme.
Best to all!


