by Calculated Risk on 12/18/2013 02:00:00 PM
Wednesday, December 18, 2013
FOMC Statement: Taper!
Information received since the Federal Open Market Committee met in October indicates that economic activity is expanding at a moderate pace. Labor market conditions have shown further improvement; the unemployment rate has declined but remains elevated. Household spending and business fixed investment advanced, while the recovery in the housing sector slowed somewhat in recent months. Fiscal policy is restraining economic growth, although the extent of restraint may be diminishing. Inflation has been running below the Committee's longer-run objective, but longer-term inflation expectations have remained stable.
Consistent with its statutory mandate, the Committee seeks to foster maximum employment and price stability. The Committee expects that, with appropriate policy accommodation, economic growth will pick up from its recent pace and the unemployment rate will gradually decline toward levels the Committee judges consistent with its dual mandate. The Committee sees the risks to the outlook for the economy and the labor market as having become more nearly balanced. The Committee recognizes that inflation persistently below its 2 percent objective could pose risks to economic performance, and it is monitoring inflation developments carefully for evidence that inflation will move back toward its objective over the medium term.
Taking into account the extent of federal fiscal retrenchment since the inception of its current asset purchase program, the Committee sees the improvement in economic activity and labor market conditions over that period as consistent with growing underlying strength in the broader economy. In light of the cumulative progress toward maximum employment and the improvement in the outlook for labor market conditions, the Committee decided to modestly reduce the pace of its asset purchases. Beginning in January, the Committee will add to its holdings of agency mortgage-backed securities at a pace of $35 billion per month rather than $40 billion per month, and will add to its holdings of longer-term Treasury securities at a pace of $40 billion per month rather than $45 billion per month. The Committee is maintaining its existing policy of reinvesting principal payments from its holdings of agency debt and agency mortgage-backed securities in agency mortgage-backed securities and of rolling over maturing Treasury securities at auction. The Committee's sizable and still-increasing holdings of longer-term securities should maintain downward pressure on longer-term interest rates, support mortgage markets, and help to make broader financial conditions more accommodative, which in turn should promote a stronger economic recovery and help to ensure that inflation, over time, is at the rate most consistent with the Committee's dual mandate
. The Committee will closely monitor incoming information on economic and financial developments in coming months and will continue its purchases of Treasury and agency mortgage-backed securities, and employ its other policy tools as appropriate, until the outlook for the labor market has improved substantially in a context of price stability. If incoming information broadly supports the Committee's expectation of ongoing improvement in labor market conditions and inflation moving back toward its longer-run objective, the Committee will likely reduce the pace of asset purchases in further measured steps at future meetings. However, asset purchases are not on a preset course, and the Committee's decisions about their pace will remain contingent on the Committee's outlook for the labor market and inflation as well as its assessment of the likely efficacy and costs of such purchases.
To support continued progress toward maximum employment and price stability, the Committee today reaffirmed its view that a highly accommodative stance of monetary policy will remain appropriate for a considerable time after the asset purchase program ends and the economic recovery strengthens. The Committee also reaffirmed its expectation that the current exceptionally low target range for the federal funds rate of 0 to 1/4 percent will be appropriate at least as long as the unemployment rate remains above 6-1/2 percent, inflation between one and two years ahead is projected to be no more than a half percentage point above the Committee's 2 percent longer-run goal, and longer-term inflation expectations continue to be well anchored. In determining how long to maintain a highly accommodative stance of monetary policy, the Committee will also consider other information, including additional measures of labor market conditions, indicators of inflation pressures and inflation expectations, and readings on financial developments. The Committee now anticipates, based on its assessment of these factors, that it likely will be appropriate to maintain the current target range for the federal funds rate well past the time that the unemployment rate declines below 6-1/2 percent, especially if projected inflation continues to run below the Committee's 2 percent longer-run goal. When the Committee decides to begin to remove policy accommodation, it will take a balanced approach consistent with its longer-run goals of maximum employment and inflation of 2 percent.
Voting for the FOMC monetary policy action were: Ben S. Bernanke, Chairman; William C. Dudley, Vice Chairman; James Bullard; Charles L. Evans; Esther L. George; Jerome H. Powell; Jeremy C. Stein; Daniel K. Tarullo; and Janet L. Yellen. Voting against the action was Eric S. Rosengren, who believes that, with the unemployment rate still elevated and the inflation rate well below the federal funds rate target, changes in the purchase program are premature until incoming data more clearly indicate that economic growth is likely to be sustained above its potential rate.
emphasis added
Comments: Housing Starts and Mortgage Index
by Calculated Risk on 12/18/2013 11:46:00 AM
A few comments:
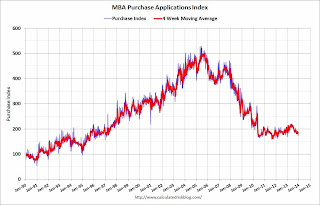
• The MBA purchase index is down about 10% year-over-year, and this has led to some articles like this from CNBC: Mortgage applications plummet amid uncertainty
Purchase applications though are down 10 percent, mirroring a slowdown in home sales in many previously hot markets.The slowdown in existing home sales is mostly due to less investor buying and fewer distressed sales (fewer cash buyers). Declining distressed sales, but increasing conventional sales - even if total sales decline - is a good sign!
And an important note on the Purchase Index: the index is probably understating purchase activity due to a change in the mix of lenders. There are more small lenders that focus on purchase loans (and sell to Fannie and Freddie), and these lenders are underrepresented in the purchase index. I discussed this two weeks ago with the MBA's Mike Fratantoni, and he told me:
[I]n the last couple of years ... independent mortgage bankers have accounted for a fast growing share of the purchase market ... We have actively recruited independents and smaller banks to get better coverage of the purchase market. ... It is likely that many of the lenders not in the survey have a higher purchase share and lower refi share.The MBA index is useful, but housing starts and new home sales provide better information.
• Overall the housing starts report was encouraging with total starts at a 1.09 million rate on a seasonally adjusted annual rate basis (SAAR) in November. This was well above the consensus forecast of 952 thousand SAAR.
• And the increase wasn't just in the volatile multi-family sector; single family starts were at the highest level since early 2008.
• Also housing starts are up significantly from the same period last year. Over the first eleven months of 2013, total starts are up over 19% compared to the same period in 2012. The increases in starts slowed in the 2nd half of 2013, but this has been a solid year for residential investment growth.
• Even with another significant year-over-year increase, housing starts are still very low. Starts averaged 1.5 million per year from 1959 through 2000, and demographics and household formation suggests starts will return to close to that level over the next few years. This suggests significantly more growth in housing starts over the next few years.
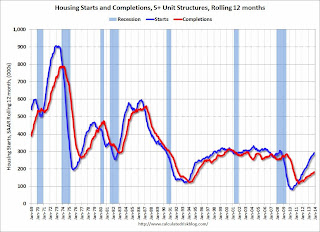
Here is an update to the graph comparing multi-family starts and completions. Since it usually takes over a year on average to complete a multi-family project, there is a lag between multi-family starts and completions. Completions are important because that is new supply added to the market, and starts are important because that is future new supply (units under construction is also important for employment).
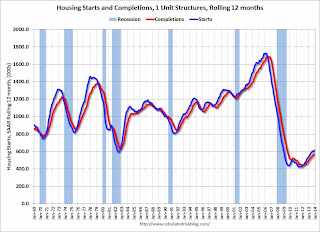
These graphs use a 12 month rolling total for NSA starts and completions.
 Click on graph for larger image.
The blue line is for multifamily starts and the red line is for multifamily completions.
The rolling 12 month total for starts (blue line) has been increasing steadily, and completions (red line) are lagging behind. It is interesting that completions have lagged so far behind starts, and this suggests completions will increase significantly in 2014 (completions lag starts by about 12 months).
However the level of multi-family starts over the last 12 months - close to the level in late '90s and early 00's - suggests that future growth in starts will mostly come from single family starts.
 The second graph shows single family starts and completions. It usually only takes about 6 months between starting a single family home and completion - so the lines are much closer. The blue line is for single family starts and the red line is for single family completions.
Starts are moving up and completions are following. Usually single family starts bounce back quickly after a recession, but not this time because of the large overhang of existing housing units.
Note the low level of single family starts and completions. The "wide bottom" was what I was forecasting several years ago, and now I expect several years of increasing single family starts and completions.
AIA: "Slight Contraction for Architecture Billings Index" in November
by Calculated Risk on 12/18/2013 10:00:00 AM
Note: This index is a leading indicator primarily for new Commercial Real Estate (CRE) investment.
From AIA: Slight Contraction for Architecture Billings Index
After six months of steadily increasing demand for design services, the Architecture Billings Index (ABI) paused in November. As a leading economic indicator of construction activity, the ABI reflects the approximate nine to twelve month lead time between architecture billings and construction spending. The American Institute of Architects (AIA) reported the November ABI score was 49.8, down from a mark of 51.6 in October. This score reflects a slight decrease in design services (any score above 50 indicates an increase in billings). The new projects inquiry index was 57.8, down from the reading of 61.5 the previous month.
“Architecture firms continue to report widely varying views of business conditions across the country. This slight dip is likely just a minor, and hopefully temporary, lull in the progress of current design projects,” said AIA Chief Economist Kermit Baker, Hon. AIA, PhD. “But there is a continued uneasiness in the marketplace as businesses attempt to determine the future direction of demand for commercial, industrial, and institutional buildings.”
emphasis added
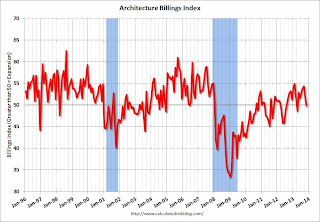
 Click on graph for larger image.
This graph shows the Architecture Billings Index since 1996. The index was at 49.8 in November, down from 51.6. Anything below 50 indicates contraction in demand for architects' services. This index has indicated expansion in 14 of the last 16 months.
Note: This includes commercial and industrial facilities like hotels and office buildings, multi-family residential, as well as schools, hospitals and other institutions.
According to the AIA, there is an "approximate nine to twelve month lag time between architecture billings and construction spending" on non-residential construction. This index is not as strong as during the '90s - or during the bubble years of 2004 through 2006 - but the readings this year suggest some increase in CRE investment in 2014.
Housing Starts at 1.09 million Annual Rate in November
by Calculated Risk on 12/18/2013 08:38:00 AM
This report is for three months due to the government shutdown; September, October and November.
From the Census Bureau: Permits, Starts and Completions
Housing Starts:
Privately-owned housing starts in November were at a seasonally adjusted annual rate of 1,091,000. This is 22.7 percent above the revised October estimate of 889,000 and is 29.6 percent above the November 2012 rate of 842,000.
Single-family housing starts in November were at a rate of 727,000; this is 20.8 percent above the revised October figure of 602,000. The November rate for units in buildings with five units or more was 354,000.
Building Permits:
Privately-owned housing units authorized by building permits in November were at a seasonally adjusted annual rate of 1,007,000. This is 3.1 percent below the revised October rate of 1,039,000, but is 7.9 percent above the November 2012 estimate of 933,000.
Single-family authorizations in November were at a rate of 634,000; this is 2.1 percent above the revised October figure of 621,000. Authorizations of units in buildings with five units or more were at a rate of 346,000 in November.
 Click on graph for larger image.
The first graph shows single and multi-family housing starts for the last several years.
Multi-family starts (red, 2+ units) increased in November (Multi-family is volatile month-to-month).
Single-family starts (blue) increased sharply to 727,000 SAAR in November.
The second graph shows total and single unit starts since 1968.
 The second graph shows the huge collapse following the housing bubble, and that housing starts have been increasing after moving sideways for about two years and a half years.
 This was well above expectations of 952 thousand starts in November. I'll have more later ... but this was a solid report.
MBA: Mortgage Applications Decrease in Latest Survey
by Calculated Risk on 12/18/2013 07:01:00 AM
From the MBA: Mortgage Applications Fall During Holiday-Shortened Week
Mortgage applications decreased 5.5 percent from one week earlier, according to data from the Mortgage Bankers Association’s (MBA) Weekly Mortgage Applications Survey for the week ending December 13, 2013. ...
The Refinance Index decreased 4 percent from the previous week. The seasonally adjusted Purchase Index decreased 6 percent from one week earlier to the lowest level since December 2012....
...
"Mortgage applications fell further last week, with the market index falling to its lowest level in more than a dozen years,” said Mike Fratantoni, MBA’s Vice President of Research and Economics. “Both purchase and refinance applications fell as interest rates increased going into today's Federal Open Market Committee meeting."
The average contract interest rate for 30-year fixed-rate mortgages with conforming loan balances ($417,000 or less) increased to 4.62 percent, the highest level since September 2013, from 4.61 percent, with points increasing to 0.38 from 0.26 (including the origination fee) for 80 percent loan-to-value ratio (LTV) loans.
emphasis added
 Click on graph for larger image.
The first graph shows the refinance index.
The refinance index is down sharply - and down 70% from the levels in early May.
 The second graph shows the MBA mortgage purchase index.
 The 4-week average of the purchase index is now down about 11% from a year ago.


