by Calculated Risk on 1/07/2014 09:31:00 AM
Tuesday, January 07, 2014
CoreLogic: House Prices up 11.8% Year-over-year in November
Notes: This CoreLogic House Price Index report is for November. The recent Case-Shiller index release was for October. The CoreLogic HPI is a three month weighted average and is not seasonally adjusted (NSA).
From CoreLogic: CoreLogic Reports Home Prices Rise by 11.8 Percent Year Over Year in November
Year over year, home prices nationwide, including distressed sales, increased 11.8 percent in November 2013 compared to November 2012. This change represents the 21st consecutive monthly year-over-year increase in home prices nationally. On a month-over-month basis, home prices nationwide, including distressed sales, increased by 0.1 percent in November 2013 compared to October 2013.
Excluding distressed sales, home prices increased 0.3 percent month over month in November 2013 compared to October 2013. On a year-over-year basis, home prices, excluding distressed sales, increased by 10.4 percent in November 2013 compared to November 2012. Distressed sales include short sales and real-estate owned (REO) transactions.
The CoreLogic Pending HPI indicates that December 2013 home prices, including distressed sales, are expected to dip 0.1 percent month over month from November to December 2013, with a projected increase of 11.5 percent on a year-over-year basis from December 2012.
 Click on graph for larger image.
 This graph shows the national CoreLogic HPI data since 1976. January 2000 = 100.
The index was up 0.1% in November, and is up 11.8% over the last year. This index is not seasonally adjusted, and the month-to-month changes will be smaller - or even negative - for next several months.
The index is off 17.6% from the peak - and is up 22.4% from the post-bubble low set in February 2012.
 The second graph is from CoreLogic. The year-over-year comparison has been positive for twenty one consecutive months suggesting house prices bottomed early in 2012 on a national basis (the bump in 2010 was related to the tax credit).
This is a slightly smaller year-over-year gain than in October, and I expect the year-over-year price increases to slow in the coming months.
Trade Deficit decreased in November to $34.3 Billion
by Calculated Risk on 1/07/2014 08:44:00 AM
The Department of Commerce reported this morning:
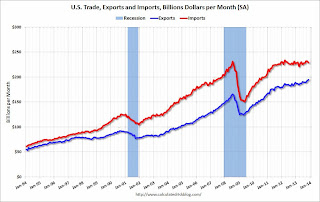
[T]otal November exports of $194.9 billion and imports of $229.1 billion resulted in a goods and services deficit of $34.3 billion, down from $39.3 billion in October, revised. November exports were $1.7 billion more than October exports of $193.1 billion. November imports were $3.4 billion less than October imports of $232.5 billion.The trade deficit was less than the consensus forecast of $39.9 billion.
The first graph shows the monthly U.S. exports and imports in dollars through November 2013.
 Click on graph for larger image.
Imports decreased, and exports increased in November.
Exports are 17% above the pre-recession peak and up 5% compared to November 2012; imports are just below the pre-recession peak, and down about 1% compared to November 2012.
The second graph shows the U.S. trade deficit, with and without petroleum, through November.
 The blue line is the total deficit, and the black line is the petroleum deficit, and the red line is the trade deficit ex-petroleum products.
Oil averaged $94.69 in November, down from $99.96 in October, and down from $97.45 in November 2012. The petroleum deficit has generally been declining and is the major reason the overall deficit has declined since early 2012.
The trade deficit with China decreased to $26.9 billion in November, down from $28.9 billion in November 2012. A majority of the trade deficit is related to China.
Overall it appears exports are picking up a little again.
Monday, January 06, 2014
Tuesday: Trade Deficit, Q4 Apartment Vacancy Survey
by Calculated Risk on 1/06/2014 07:14:00 PM
From the WSJ: Yellen Confirmed as Fed Chief
Ms. Yellen, currently the vice chairwoman of the Fed's board of governors, was confirmed in a 56-26 vote to become the first female chief in the central bank's 100-year history. Eleven Republicans joined 45 Democrats to support Ms. Yellen. No Democrats opposed her. Weather-related travel problems caused some lawmakers to miss the vote.An excellent choice.
...
Mr. Bernanke will preside at the Fed's policy meeting Jan. 28-29. His last day as chairman is Jan. 31. Ms. Yellen is expected to be sworn into office Feb. 1 and lead the Fed's policy meeting in March.
Tuesday:
• Early: Reis Q4 2013 Apartment Survey of rents and vacancy rates.
• At 8:30 AM ET, the Trade Balance report for November from the Census Bureau. The consensus is for the U.S. trade deficit to decrease to $39.9 billion in November from $40.6 billion in October.
Weekly Update: Housing Tracker Existing Home Inventory up 2.0% year-over-year on Jan 6h
by Calculated Risk on 1/06/2014 03:44:00 PM
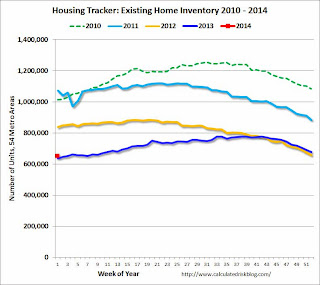
Here is another weekly update on housing inventory ... for the twelfth consecutive week, housing inventory is up year-over-year. This suggests inventory bottomed early in 2013.
There is a clear seasonal pattern for inventory, with the low point for inventory in late December or early January, and then peaking in mid-to-late summer.
The Realtor (NAR) data is monthly and released with a lag (the most recent data was for November). However Ben at Housing Tracker (Department of Numbers) has provided me some weekly inventory data for the last several years.
 Click on graph for larger image.
This graph shows the Housing Tracker reported weekly inventory for the 54 metro areas for 2010, 2011, 2012, 2013 and 2014.
In 2011 and 2012, inventory only increased slightly early in the year and then declined significantly through the end of each year.
Inventory in 2014 is now 2.0% above the same week in 2013 (red dot is 2014, blue is 2013).
Inventory is still very low - and barely up year-over-year - but this increase in inventory should slow house price increases.
Note: One of the key questions for 2014 will be: How much will inventory increase? My guess is inventory will be up 10% to 15% year-over-year by the end of 2014 (this would still be a little below normal).
ISM Indexes and BLS Employment Report
by Calculated Risk on 1/06/2014 01:29:00 PM
Every month I post an employment preview, and two of the data points I use are the ISM manufacturing employment index, and the ISM non-manufacturing employment index. In the monthly preview, I mention the historical correlation.
Here are two scatter graphs showing the relationship between the ISM employment indexes for manufacturing and service, and monthly changes in BLS payroll employment.
 Click on graph for larger image.
This graph shows the relationship between the ISM manufacturing employment index and the change in BLS manufacturing employment (as a percent of the previous month employment).
The yellow dot is a forecast for December based on the ISM employment reading of 56.9. This suggests about 18,000 manufacturing jobs added in December (although there is plenty of noise, and R-squared is 0.63.
 This is also noisy (R-squared is 0.68), but a reading of 55.8 suggests an increase of about 227,000 service sector payroll jobs in December (blue dot on graph). So the ISM reports suggests private sector job growth in December of around 245,000.
I'll mention this again in the monthly preview. This is useful but "noisy".


