by Calculated Risk on 1/13/2014 09:21:00 AM
Monday, January 13, 2014
Lawler: Preliminary Table of Distressed Sales and Cash buyers for Selected Cities in December
Economist Tom Lawler sent me the preliminary table below of short sales, foreclosures and cash buyers for several selected cities in December.
From CR: This is just a few markets - more to come over the next week - but total "distressed" share is down significantly, mostly because of a decline in short sales.
And foreclosures are down in all of these areas too.
The All Cash Share (last two columns) is mostly declining year-over-year. As investors pull back in markets the share of all cash buyers will probably decline.
In general it appears the housing market is slowly moving back to normal.
| Short Sales Share | Foreclosure Sales Share | Total "Distressed" Share | All Cash Share | |||||
|---|---|---|---|---|---|---|---|---|
| Dec-13 | Dec-12 | Dec-13 | Dec-12 | Dec-13 | Dec-12 | Dec-13 | Dec-12 | |
| Las Vegas | 20.7% | 45.8% | 8.5% | 9.5% | 29.2% | 55.3% | 44.4% | 55.2% |
| Reno | 24.0% | 47.0% | 4.0% | 10.0% | 28.0% | 57.0% | ||
| Phoenix | 9.5% | 27.2% | 7.5% | 12.2% | 17.1% | 39.4% | ||
| Mid-Atlantic | 8.0% | 13.0% | 9.3% | 9.7% | 17.3% | 22.7% | 19.3% | 20.3% |
| Toledo | 36.5% | 41.6% | ||||||
| Tucson | 32.3% | 33.1% | ||||||
| Omaha | 23.9% | 20.6% | ||||||
| Memphis* | 21.0% | 25.6% | ||||||
| *share of existing home sales, based on property records | ||||||||
Sunday, January 12, 2014
Sunday Night Futures
by Calculated Risk on 1/12/2014 08:16:00 PM
From the WSJ: Why Business Investment Could Break Out
One gauge of business investment—new orders of nondefense capital goods, excluding aircraft—grew 4.1% in November, the biggest jump in nearly a year, after shrinking for two months. A broader measure of business spending that includes buildings and software grew at an annualized pace of 4.8% in the third quarter of 2013 and 4.7% in the second, after declining 4.6% in the first quarter.When demand picks up, companies invest ...
Economists now expect business spending to keep accelerating. ... Several things are pushing economists' forecasts for business spending higher. For one, businesses often follow consumers when it comes to spending, not the other way around. When the economy began growing again after the 2007-2009 recession, spending on equipment shot up—but then flagged when it became clear, by 2011, that the recovery had stalled. If the economic recovery now shifts into higher gear, businesses will expand capacity to meet demand.
Monday:
• At 2:00 PM ET, the Monthly Treasury Budget Statement for December. The CBO estimates that the Treasury ran a surplus of $44 billion in December.
Weekend:
• Schedule for Week of January 12th
• Update: When will payroll employment exceed the pre-recession peak?
From CNBC: Pre-Market Data and Bloomberg futures: the S&P futures and DOW futures are unchanged (fair value).
Oil prices are mostly unchanged with WTI futures at $92.80 per barrel and Brent at $107.49 per barrel.
Below is a graph from Gasbuddy.com for nationwide gasoline prices. Nationally prices are around $3.30 per gallon (about the same as a year ago). If you click on "show crude oil prices", the graph displays oil prices for WTI, not Brent; gasoline prices in most of the U.S. are impacted more by Brent prices.
| Orange County Historical Gas Price Charts Provided by GasBuddy.com |
More Employment Graphs: Duration of Unemployment, Unemployment by Education, Construction Employment and Diffusion Indexes
by Calculated Risk on 1/12/2014 11:51:00 AM
Friday on the employment report:
• December Employment Report: 74,000 Jobs, 6.7% Unemployment Rate
• Comments on the Disappointing Employment Report
A few more employment graphs by request ...
 This graph shows the duration of unemployment as a percent of the civilian labor force. The graph shows the number of unemployed in four categories: less than 5 week, 6 to 14 weeks, 15 to 26 weeks, and 27 weeks or more.
The general trend is down for all categories, and both the "less than 5 weeks" and 6 to 14 weeks" are close to normal levels.
The long term unemployed is at 2.5% of the labor force - the lowest since April 2009 - however the number (and percent) of long term unemployed remains a serious problem.
 This graph shows the unemployment rate by four levels of education (all groups are 25 years and older).
Unfortunately this data only goes back to 1992 and only includes one previous recession (the stock / tech bust in 2001). Clearly education matters with regards to the unemployment rate - and it appears all four groups are generally trending down.
Although education matters for the unemployment rate, it doesn't appear to matter as far as finding new employment.
Note: This says nothing about the quality of jobs - as an example, a college graduate working at minimum wage would be considered "employed".
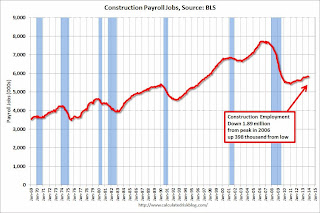
 This graph shows total construction employment as reported by the BLS (not just residential).
Since construction employment bottomed in January 2011, construction payrolls have increased by 398 thousand.
According to the BLS, construction employment declined in December (probably due to weather). Historically there is a lag between an increase in activity and more hiring - and it appears hiring should pickup significant in 2014.
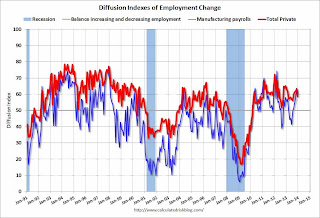
 The BLS diffusion index for total private employment was at 58.8 in December, down from 63.2 in November.
For manufacturing, the diffusion index increased to 60.5, down from 63.6 in November.
Think of this as a measure of how widespread job gains are across industries. The further from 50 (above or below), the more widespread the job losses or gains reported by the BLS. From the BLS:
Figures are the percent of industries with employment increasing plus one-half of the industries with unchanged employment, where 50 percent indicates an equal balance between industries with increasing and decreasing employment.Job growth was still fairly widespread in December (a good sign even with fewer jobs added).
Saturday, January 11, 2014
Update: When will payroll employment exceed the pre-recession peak?
by Calculated Risk on 1/11/2014 05:13:00 PM
Just over two years ago I posted a graph with projections of when payroll employment would return to pre-recession levels (see: Sluggish Growth and Payroll Employment from November 2011).
In 2011, I argued we'd continue to see sluggish growth (back in 2011 many analysts were forecasting another US recession - those forecasts were wrong).
On the graph I posted two lines - one with payroll growth of 125,000 payroll jobs added per month (the pace in 2011), and another line with 200,000 payroll jobs per month. The following graph is an update with reported payroll growth through December 2013.
The dashed red line is 125,000 payroll jobs added per month. The dashed blue line is 200,000 payroll jobs per month. Both projections are from November 2011.
 Click on graph for larger image.
So far the economy has tracked just below the blue line (200,000 payroll jobs per month).
Right now it appears payrolls will exceed the pre-recession peak in mid-2014.
Currently there are about 1.18 million fewer payroll jobs than before the recession started, and at the expected pace of job growth in 2014 it will take about 6 months to reach the previous peak.
Of course this doesn't include population growth and new entrants into the workforce (the workforce has continued to grow). Also the annual benchmark revision will be released in February (with the January employment report), and the preliminary estimate is an upward revision of 345,000 jobs - HOWEVER the increase is due to a classification change, and the actual impact will probably be negative.
Note: There are 640 thousand fewer private sector payroll jobs than before the recession started. At the expected pace of private sector job growth, the private sector could be back at the pre-recession peak in March 2014.
Schedule for Week of January 12th
by Calculated Risk on 1/11/2014 11:18:00 AM
The key reports this week are retail sales and housing starts for December.
For manufacturing, Industrial Production for December, and the NY Fed (Empire State), and Philly Fed January surveys will be released this week.
For prices, CPI will be released on Thursday.
2:00 PM ET: the Monthly Treasury Budget Statement for December. The CBO estimates that the Treasury ran a surplus of $44 billion in December.
7:30 AM ET: NFIB Small Business Optimism Index for December.
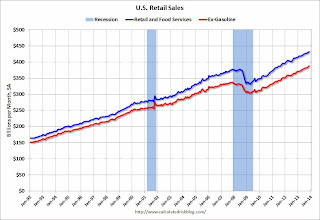
 8:30 AM ET: Retail sales for December will be released.
This graph shows retail sales since 1992. This is monthly retail sales and food service, seasonally adjusted (total and ex-gasoline). On a monthly basis, retail sales increased 0.7% from October to November (seasonally adjusted), and sales were up 4.7% from November 2012.
The consensus is for retail sales to be unchanged in December, and to increase 0.4% ex-autos.
10:00 AM: Manufacturing and Trade: Inventories and Sales (business inventories) report for November. The consensus is for a 0.3% increase in inventories.
7:00 AM: The Mortgage Bankers Association (MBA) will release the results for the mortgage purchase applications index for the previous two weeks.
8:30 AM: Producer Price Index for December. The consensus is for a 0.4% increase in producer prices (and 0.1% increase in core PPI).
8:30 AM: NY Fed Empire Manufacturing Survey for January. The consensus is for a reading of 3.3, up from 1.0 in December (above zero is expansion).
2:00 PM: Federal Reserve Beige Book, an informal review by the Federal Reserve Banks of current economic conditions in their Districts.
8:30 AM: The initial weekly unemployment claims report will be released. The consensus is for claims to decline to 327 thousand from 330 thousand.
8:30 AM: Consumer Price Index for December. The consensus is for a 0.3% increase in CPI in December and for core CPI to increase 0.1%.
10:00 AM: the Philly Fed manufacturing survey for January. The consensus is for a reading of 8.7, up from 7.0 last month (above zero indicates expansion).
10:00 AM ET: The January NAHB homebuilder survey. The consensus is for a reading of 57.5, down from 58.0 in December. Any number above 50 indicates that more builders view sales conditions as good than poor.
 8:30 AM: Housing Starts for December.
 Total housing starts were at 1.09 million (SAAR) in November. Single family starts were at 727 thousand SAAR in November.
The consensus is for total housing starts to decrease to 985 thousand (SAAR) in December.
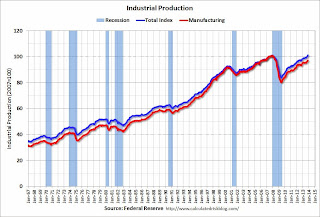
 9:15 AM: The Fed will release Industrial Production and Capacity Utilization for December.
This graph shows industrial production since 1967.
The consensus is for a 0.3% increase in Industrial Production, and for Capacity Utilization to increase to 79.1%.
9:55 AM: Reuter's/University of Michigan's Consumer sentiment index (preliminary for January). The consensus is for a reading of 83.5, up from 82.5 in December.
 10:00 AM: Job Openings and Labor Turnover Survey for November from the BLS.
 This graph shows job openings (yellow line), hires (purple), Layoff, Discharges and other (red column), and Quits (light blue column) from the JOLTS.
Jobs openings increased in October to 3.925 million from 3.883 million in September. The number of job openings (yellow) is up 7.7% year-over-year compared to October 2012 and openings are at the highest level since early 2008.
Quits increase in October and are up about 14.7% year-over-year. These are voluntary separations. (see light blue columns at bottom of graph for trend for "quits"). This is the highest level for quits since 2008.


