by Calculated Risk on 1/14/2014 08:39:00 AM
Tuesday, January 14, 2014
Retail Sales increased 0.2% in December
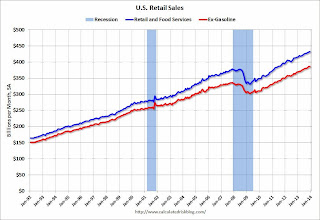
On a monthly basis, retail sales increased 0.2% from November to December (seasonally adjusted), and sales were up 4.7% from December 2012. Sales in November were revised down from a 0.7% increase to 0.4%. From the Census Bureau report:
The U.S. Census Bureau announced today that advance estimates of U.S. retail and food services sales for December, adjusted for seasonal variation and holiday and trading-day differences, but not for price changes, were $431.9 billion, an increase of 0.2 percent from the previous month, and 4.1 percent (±0.7%) above December 2012. ... The October to November 2013 percent change was revised from +0.7 percent to +0.4 percent.
 Click on graph for larger image.
This graph shows retail sales since 1992. This is monthly retail sales and food service, seasonally adjusted (total and ex-gasoline).
Retail sales ex-autos increased 0.7%.
The second graph shows the year-over-year change in retail sales and food service (ex-gasoline) since 1993.
 Retail sales ex-gasoline increased by 4.6% on a YoY basis (4.1% for all retail sales).
The increase in December was above consensus expectations, but was close including the downward revision to November.
Monday, January 13, 2014
Tuesday: Retail Sales
by Calculated Risk on 1/13/2014 08:29:00 PM
With the recent sell-off, here is a market graph (click on graph for larger image) from Doug Short that shows the S&P 500 since the 2007 high ...
Tuesday:
• At 7:00 AM ET, the NFIB Small Business Optimism Index for December.
• At 8:30 AM, the Retail sales report for December will be released. The consensus is for retail sales to be unchanged in December, and to increase 0.4% ex-autos.
• At 10:00 AM, the Manufacturing and Trade: Inventories and Sales (business inventories) report for November. The consensus is for a 0.3% increase in inventories.
Weekly Update: Housing Tracker Existing Home Inventory up 2.0% year-over-year on Jan 13th
by Calculated Risk on 1/13/2014 04:07:00 PM
Here is another weekly update on housing inventory ... for the thirteenth consecutive week, housing inventory is up year-over-year. This suggests inventory bottomed early in 2013.
There is a clear seasonal pattern for inventory, with the low point for inventory in late December or early January, and then peaking in mid-to-late summer.
The Realtor (NAR) data is monthly and released with a lag (the most recent data was for November). However Ben at Housing Tracker (Department of Numbers) has provided me some weekly inventory data for the last several years.
 Click on graph for larger image.
This graph shows the Housing Tracker reported weekly inventory for the 54 metro areas for 2010, 2011, 2012, 2013 and 2014.
In 2011 and 2012, inventory only increased slightly early in the year and then declined significantly through the end of each year.
Inventory in 2014 is now 2.0% above the same week in 2013 (red is 2014, blue is 2013).
Inventory is still very low - and barely up year-over-year - but this increase in inventory should slow house price increases.
Note: One of the key questions for 2014 will be: How much will inventory increase? My guess is inventory will be up 10% to 15% year-over-year by the end of 2014 (this would still be a little below normal).
Treasury: $53 Billion Budget Surplus in December
by Calculated Risk on 1/13/2014 03:36:00 PM
From the WSJ: U.S. Posts December Budget Surplus of $53.22 Billion
Revenues outpaced spending by $53.22 billion in December, the first surplus for the month since the 2007 fiscal year and the biggest on record. Economists surveyed by Dow Jones had forecast a $44.5 billion surplus.Here is the Monthly Treasury Statement for December.
...
The U.S. government's deficit for October through December totaled $173.60 billion, down 41% from the $293.30 billion shortfall during the same period a year earlier, the Treasury Department said Monday in its monthly report. The 2014 fiscal year started on Oct. 1.
In December 2012 the deficit was $1.2 billion. Taxes were raised in January 2013, so the comparison next month will show how much of the improvement is related to taxes - and how much due to an improving economy. The deficit has declined very quickly over the last few years - and is no longer a short term issue.
Update: The California Budget Surplus
by Calculated Risk on 1/13/2014 10:33:00 AM
In November 2012, I was interviewed by Joe Weisenthal at Business Insider. One of my comments during our discussion on state and local governments was:
I wouldn’t be surprised if we see all of a sudden a report come out, “Hey, we’ve got a balanced budget in California.”At the time that was way out of the consensus view. And a couple of months later California announced a balanced budget, see The California Budget Surplus
The situation has improved since then. Here is the most recent update from California State Controller John Chiang: Controller Releases December Cash Update
State Controller John Chiang today released his monthly report covering California's cash balance, receipts and disbursements in December 2013. Revenues for the month totaled $10.6 billion, surpassing estimates in the state budget by $2.3 billion, or 27.7 percent.This is just one state, but I expect local and state governments (in the aggregate) to add to both GDP and employment in 2014.
Total revenues for the fiscal year-to-date were $2.5 billion ahead (6.4 percent) of budget estimates.
"Revenues for the first half of the fiscal year are well ahead of estimates and reflect a surging economy fueled by a boom in technology, rising exports, improving consumer confidence, and a new housing upswing," said Chiang.
emphasis added


