by Calculated Risk on 1/14/2014 08:15:00 PM
Tuesday, January 14, 2014
Wednesday: NY Fed Mfg Survey, PPI, Beige Book
Several people asked me about this Financial Times article today: Fannie Mae warns of fall in US house prices
[Doug Duncan, chief economist at Fannie Mae] said that retreating institutional buyers could eventually contribute to a drop in house prices in certain US markets, if they begin selling off their property portfolios at the same time that housing builders begin to ramp up their activity.All Duncan is saying is that some markets might see price declines if investors start selling (I don't think investors will try to sell that many houses soon, so I'm not concerned).
...
“The investors have provided a very valuable service in helping transition these properties,” Mr Duncan said. “Will they find that their returns are maximised and it’s time to exit at the same time that the builders hit their stride?”
Yesterday Duncan came out with an upbeat forecast for 2014: Housing's Contribution to GDP Expected to Improve from 2013
“The continued housing recovery also is expected to contribute to GDP, doubling from 0.3 percentage points in 2013 to 0.6 percentage points in 2014, due in large part to new homebuilding activity,” said Duncan. “Despite the rise in mortgage rates since the spring, many housing indicators posted strong gains at the end of 2013 and consumer housing attitudes are strengthening, all of which bodes well for continued but measured housing recovery in 2014. Overall, although we don’t expect growth to break the 3 percent barrier this year, we believe the economy is on a sustainable path for continued growth with upside potential.”That is close to my view for 2014 (I'm a little more optimistic).
Wednesday:
• At 7:00 AM ET, the Mortgage Bankers Association (MBA) will release the results for the mortgage purchase applications index.
• At 8:30 AM, the NY Fed Empire Manufacturing Survey for January. The consensus is for a reading of 3.3, up from 1.0 in December (above zero is expansion).
• Also at 8:30 AM, the Producer Price Index for December. The consensus is for a 0.4% increase in producer prices (and 0.1% increase in core PPI).
• At 2:00 PM, the Federal Reserve Beige Book, an informal review by the Federal Reserve Banks of current economic conditions in their Districts.
Lawler: Updated Table of Distressed Sales and Cash buyers for Selected Cities in December
by Calculated Risk on 1/14/2014 05:10:00 PM
Economist Tom Lawler sent me the updated table below of short sales, foreclosures and cash buyers for several selected cities in December.
From CR: This is just a few markets - still more to come - but total "distressed" share is down in all of these markets, and down significantly in most. This is mostly because of a decline in short sales.
And foreclosures are down in all of these areas too (except Springfield, Ill).
The All Cash Share (last two columns) is mostly declining year-over-year. It appears investors are pulling back in markets like Las Vegas and SoCal - probably because of fewer distressed sales and higher prices.
| Short Sales Share | Foreclosure Sales Share | Total "Distressed" Share | All Cash Share | |||||
|---|---|---|---|---|---|---|---|---|
| Dec-13 | Dec-12 | Dec-13 | Dec-12 | Dec-13 | Dec-12 | Dec-13 | Dec-12 | |
| Las Vegas | 20.7% | 45.8% | 8.5% | 9.5% | 29.2% | 55.3% | 44.4% | 55.2% |
| Reno | 24.0% | 47.0% | 4.0% | 10.0% | 28.0% | 57.0% | ||
| Phoenix | 9.5% | 27.2% | 7.5% | 12.2% | 17.1% | 39.4% | ||
| Minneapolis | 5.4% | 12.4% | 17.3% | 26.7% | 22.7% | 39.1% | ||
| Mid-Atlantic | 8.0% | 13.0% | 9.3% | 9.7% | 17.3% | 22.7% | 19.3% | 20.3% |
| So. California* | 13.2% | 26.7% | 5.8% | 14.2% | 19.0% | 40.9% | 27.7% | 35.8% |
| Hampton Roads | 29.1% | 31.7% | ||||||
| Northeast Florida | 36.2% | 42.7% | ||||||
| Toledo | 36.5% | 41.6% | ||||||
| Tucson | 32.3% | 33.1% | ||||||
| Des Moines | 23.1% | 21.6% | ||||||
| Omaha | 23.9% | 20.6% | ||||||
| Memphis* | 21.0% | 25.6% | ||||||
| Springfield IL** | 17.7% | 14.2% | ||||||
| *share of existing home sales, based on property records | ||||||||
| **Single Family Only | ||||||||
DataQuick on SoCal: December Home Sales at Six-Year Low, Foreclosure Resales lowest since May 2007
by Calculated Risk on 1/14/2014 02:17:00 PM
From DataQuick: Southland December Home Sales at Six-Year Low; Median Price Jumps
Southern California home sales fell to a six-year low for the month of December as investor activity eased again and buyers struggled with a tight inventory of homes for sale. ... A total of 18,415 new and resale houses and condos sold in Los Angeles, Riverside, San Diego, Ventura, San Bernardino and Orange counties last month. That was up 6.5 percent from 17,283 sales in November, and down 9.2 percent from 20,274 sales in December 2012, according to San Diego-based DataQuick.Both distress sales and investor buying is declining - and this is dragging down overall sales (plus inventory is still very low). However conventional sales are up about 25% year-over-year.
December’s sales gain from November is normal for the season, though it was weaker than usual. ... Last month’s sales were 24.1 percent below the average number of sales – 24,254 – in the month of December. Southland sales haven’t been above average for any particular month in more than seven years. December sales have ranged from a low of 13,240 in December 2007 to high of 36,865 in December 2003.
Foreclosure resales – homes foreclosed on in the prior 12 months – accounted for 5.8 percent of the Southland resale market in December. That was down from 6.3 percent the prior month and was down from 14.2 percent a year earlier. Last month’s foreclosure resale rate was the lowest since it was 5.4 percent in May 2007. In the current cycle, foreclosure resales hit a high of 56.7 percent in February 2009.
Short sales – transactions where the sale price fell short of what was owed on the property – made up an estimated 13.2 percent of Southland resales last month. That was up slightly from 12.8 percent the prior month and down from 26.7 percent a year earlier.
Absentee buyers – mostly investors and some second-home purchasers – bought 26.2 percent of the Southland homes sold last month. That’s the lowest share for any month since it was 25.1 percent in November 2011. Last month’s absentee level was down from 26.6 percent the month before and down from 30.4 percent a year earlier. The absentee share has trended lower almost every month since hitting a record 32.4 percent in January 2013.
emphasis added
It is important to recognize that declining existing home sales is NOT a negative indicator for the housing recovery. The reason for the decline in overall existing home sales is fewer distressed sales and less investor buying. Those are positive trends!
Note: Also - the housing recovery (GDP and employment growth) is mostly new home sales, not existing home sales - so the focus for the "recovery" should be on new home sales and housing starts.
Mortgage Monitor: 2013 Vintage "best-performing on record", Purchase Mortgages over 50% of originations
by Calculated Risk on 1/14/2014 12:13:00 PM
Black Knight Financial Services (BKFS, formerly the LPS Data & Analytics division) released their Mortgage Monitor report for November today. According to LPS, 6.45% of mortgages were delinquent in November, up from 6.28% in October. BKFS reports that 2.54% of mortgages were in the foreclosure process, down from 3.61% in November 2012.
This gives a total of 8.99% delinquent or in foreclosure. It breaks down as:
• 1,958,000 properties that are 30 or more days, and less than 90 days past due, but not in foreclosure.
• 1,283,000 properties that are 90 or more days delinquent, but not in foreclosure.
• 1,256,000 loans in foreclosure process.
For a total of 4,497,000 loans delinquent or in foreclosure in November. This is down from 5,350,000 in November 2012.
 Click on graph for larger image.
This graph from BKFS shows percent of loans delinquent and in the foreclosure process over time.
From BKFS:
• DQs following typical seasonal pattern, FCs continue to improve (with reduced holiday activity)Delinquencies and foreclosures are still high, but moving down - and might be back to normal levels in a couple of years. The judicial foreclosure states (like NJ and NY) are lagging behind.
• NJ and NY non-current rates are now on par with FL and NV, 2x rates in CA and AZ
 From BKFS on originations:
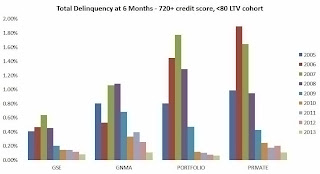
• Originations are at the lowest levels since early 2010 with purchases over 50% of totalThe second graph from BKFS shows the total delinquency rate at 6 months after origination. the 2013 vintage is the best ever.
• Non-agency participation has increased relative to government
• 2013 originations are the best performing vintage on record
• Second lien prevalence is still low in recent vintages but HE originations are on the rise
“Looking at the most current mortgage origination data, several points become clear,” said Herb Blecher, senior vice president of Black Knight Financial Services’ Data & Analytics division. “First is that heightened credit standards have resulted in this year being the best-performing vintage on record. Even adjusting for some of these changes, such as credit scores and loan-to-values, we are seeing total delinquencies for 2013 loans at extremely low levels across every product category. Secondly, while overall volumes are down, we are seeing an increased proportion of the market being supported by non-agency (vs. government) lending – with the share nearly doubling as compared to 2010.
“Although tighter credit requirements, coupled with interest rate increases, have helped drive originations down to their lowest level since 2010, thanks to increasing home prices, we have seen a significant increase in home equity lending. While first mortgage originations are almost half the levels as one year ago, total home equity lending, including loans and lines, has increased by 70 percent, and originations of second lien home equity loans have more than doubled. Finally, in the first lien market, we also observed a 75 percent year-over-year increase in the share of non-agency jumbo prime lending. Notably, nearly all of these jumbo loans have been originated with no mortgage insurance, which may indicate an increased appetite for risk, as well as an opportunity to expand credit criteria, for originations within the private market.”
emphasis added
There is much more in the mortgage monitor.
NFIB: Small Business Optimism Index increases in December
by Calculated Risk on 1/14/2014 09:55:00 AM
From the National Federation of Independent Business (NFIB): Small Businesses Optimism Increases in December
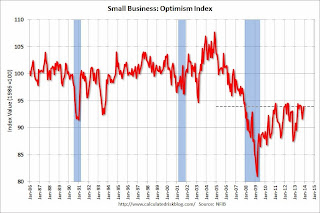
Small-business optimism ended the year slightly up from November at 93.9, but below the previous 3 mid-year readings of over 94 and 6 points below the pre-recession average, according to the National Federation of Independent Business’ (NFIB’s) latest index. On the positive front, reports of capital spending rose significantly in December, increasing by 9 points from November and job creation among NFIB firms was the best since February 2006.
...
Owners increased employment by an average of 0.24 workers in December, the best reading since February 2006.
 Click on graph for larger image.
This graph shows the small business optimism index since 1986. The index increased to 39.9 in December from 92.5 in November.
Another positive: During the recession, the single most important problem was "poor sales". The percentage of owners naming "poor sales" has fallen significantly to 14 percent, and small business owners are once again complaining about taxes and government - this is what they complain about in good times!


