by Calculated Risk on 1/17/2014 09:55:00 AM
Friday, January 17, 2014
Preliminary January Consumer Sentiment declines to 80.4

Click on graph for larger image.
The preliminary Reuters / University of Michigan consumer sentiment index for January was at 80.4, down from the December reading of 82.5.
This was below the consensus forecast of 83.5. Sentiment has generally been improving following the recession - with plenty of ups and downs - and a big spike down when Congress threatened to "not pay the bills" in 2011, and another smaller spike down last October and November due to the government shutdown.
I expect to see sentiment at post-recession highs very soon.
Fed: Industrial Production increased 0.3% in December
by Calculated Risk on 1/17/2014 09:15:00 AM
From the Fed: Industrial production and Capacity Utilization
Industrial production rose 0.3 percent in December, its fifth consecutive monthly increase. For the fourth quarter as a whole, industrial production advanced at an annual rate of 6.8 percent, the largest quarterly increase since the second quarter of 2010; gains were widespread across industries. Following increases of 0.6 percent in each of the previous two months, factory output rose 0.4 percent in December and was 2.6 percent above its year-earlier level. The production of mines moved up 0.8 percent; the index has advanced 6.6 percent over the past 12 months. The output of utilities fell 1.4 percent after three consecutive monthly gains. At 101.8 percent of its 2007 average, total industrial production in December was 3.7 percent above its year-earlier level and 0.9 percent above its pre-recession peak in December 2007. Capacity utilization for total industry moved up 0.1 percentage point to 79.2 percent, a rate 1.0 percentage point below its long-run (1972–2012) average.
emphasis added
 Click on graph for larger image.
This graph shows Capacity Utilization. This series is up 12.3 percentage points from the record low set in June 2009 (the series starts in 1967).
Capacity utilization at 79.2% is still 1.0 percentage points below its average from 1972 to 2012 and below the pre-recession level of 80.8% in December 2007.
Note: y-axis doesn't start at zero to better show the change.
 The second graph shows industrial production since 1967.
Industrial production increased 0.3% in December to 101.3. This is 22% above the recession low, and 0.9 percent above the pre-recession peak.
The monthly change for both Industrial Production and Capacity Utilization were at expectations, however previous months were revised up.
Housing Starts at 999 Thousand Annual Rate in December
by Calculated Risk on 1/17/2014 08:30:00 AM
From the Census Bureau: Permits, Starts and Completions
Housing Starts:
Privately-owned housing starts in December were at a seasonally adjusted annual rate of 999,000. This is 9.8 percent below the revised November estimate of 1,107,000, but is 1.6 percent above the December 2012 rate of 983,000.
Single-family housing starts in December were at a rate of 667,000; this is 7.0 percent below the revised November figure of 717,000. The December rate for units in buildings with five units or more was 312,000.
An estimated 923,400 housing units were started in 2013. This is 18.3 percent above the 2012 figure of 780,600.
emphasis added
Building Permits:
Privately-owned housing units authorized by building permits in December were at a seasonally adjusted annual rate of 986,000. This is 3.0 percent below the revised November rate of 1,017,000, but is 4.6 percent above the December 2012 estimate of 943,000.
Single-family authorizations in December were at a rate of 610,000; this is 4.8 percent below the revised November figure of 641,000. Authorizations of units in buildings with five units or more were at a rate of 350,000 in December.
 Click on graph for larger image.
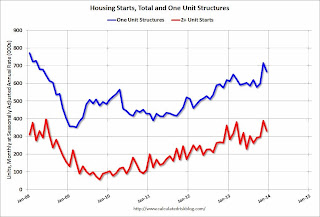
The first graph shows single and multi-family housing starts for the last several years.
Multi-family starts (red, 2+ units) decreased in December (Multi-family is volatile month-to-month).
Single-family starts (blue) also decreased in December following the sharp increase in November.
The second graph shows total and single unit starts since 1968.
 The second graph shows the huge collapse following the housing bubble, and that housing starts have been increasing after moving sideways for about two years and a half years.
 This was slightly above expectations of 985 thousand starts in December. I'll have more later ... but this was a solid year with starts up 18.3 percent from 2012.
Thursday, January 16, 2014
Friday: Housing Starts, Industrial Production, Consumer Sentiment, JOLTS
by Calculated Risk on 1/16/2014 09:00:00 PM
First, here is a price index for commercial real estate that I follow. From CoStar: Commercial Real Estate Prices Post Steady Gains in November
COMMERCIAL PROPERTY PRICES CONTINUED THEIR STEADY UPWARD TRAJECTORY IN NOVEMBER: With the U.S. economy on more solid footing during the fourth quarter of 2013 and demand for commercial real estate space on the rise, pricing continued on a steady upward trajectory in November 2013. The two broadest measures of aggregate pricing for commercial properties within the CCRSI—the value-weighted U.S. Composite Index and the equal-weighted U.S. Composite Index—advanced by 0.8% and 1.1%, respectively in November 2013, and rose by a more robust 10.9% and 7.8%, respectively, over the last year.Note: These are repeat sales indexes - like Case-Shiller for residential - but this is based on far fewer pairs.
...
ABSORPTION EXPANDS AT FASTEST RATE SINCE 2007: Tenants occupied an additional 380 million square feet of office, retail and industrial space throughout the U.S. in 2013, the largest annual gain in net absorption over the past six years. The Investment Grade segment of the market continued to dominate in space absorption. However, the pace of absorption in the General Commercial segment has improved significantly as the recovery is accelerating in the secondary and tertiary markets. The General Commercial segment’s share of total net absorption increased from being less than 30% for the last several years to 32% in 2013.
...
DISTRESS SALES REMAIN LOW: The percentage of commercial property selling at distressed prices was slightly more than 13% in November 2013, down roughly two-thirds from the peak in 2011. Technology and energy-driven markets including Houston, Denver, Dallas, and Austin have experienced some of the strongest declines in the share of distress property sales activity over the last year, with a reduction of 80% or more.
emphasis added
Friday:
• At 8:30 AM ET, Housing Starts for December. The consensus is for total housing starts to decrease to 985 thousand (SAAR) in December.
• At 9:15 AM, the Fed will release Industrial Production and Capacity Utilization for December. The consensus is for a 0.3% increase in Industrial Production, and for Capacity Utilization to increase to 79.1%.
• At 9:55 AM, the Reuter's/University of Michigan's Consumer sentiment index (preliminary for January). The consensus is for a reading of 83.5, up from 82.5 in December.
• At 10:00 AM, the Job Openings and Labor Turnover Survey for November from the BLS.
NMHC Survey: Apartment Market Conditions Softer in Q4
by Calculated Risk on 1/16/2014 01:44:00 PM
From the National Multi Housing Council (NMHC): Apartment Markets Soften Slightly According to NMHC Survey
Apartment market conditions weakened a bit in January compared with three months earlier. The market tightness (41), sales volume (41) and debt financing (42) indexes were all a little below the breakeven level of 50, although the equity financing index rebounded to 50.
“Apartment markets are little changed from October,” said Mark Obrinsky, NMHC’s Senior Vice President for Research and Chief Economist. “At least half of our respondents to each of our four main questions reported conditions as unchanged from three months earlier. Although markets are a little looser than in October, this is largely seasonal; overall markets remain fairly tight.
“New supply is finally starting to arrive at levels that will more closely match overall demand. In a few markets, we are seeing completions a little higher than absorptions, but this is likely to be short term in nature. Fundamentally, demand for apartment homes should be strong for the rest of the decade (and beyond) – provided only that the economy remains on track.”
...
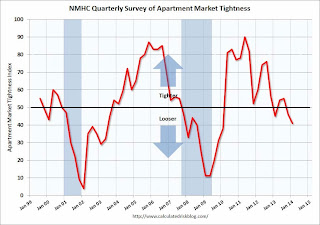
The Market Tightness Index declined to 41 from 46. Slightly more than half (56 percent) of respondents reported unchanged conditions, and approximately one-third (31 percent) saw conditions as looser than three months ago. The index last indicated overall improving conditions in July 2013. Some respondents noted that the decline was typical for this time of year and that conditions remain fairly tight.
emphasis added

Click on graph for larger image.
This graph shows the quarterly Apartment Tightness Index. Any reading below 50 indicates loosening from the previous quarter. The quarterly decrease was small, but indicates looser market conditions.
As I've mentioned before, this index helped me call the bottom for effective rents (and the top for the vacancy rate) early in 2010. This survey now suggests vacancy rates are near a bottom.


