by Calculated Risk on 1/28/2014 10:40:00 AM
Tuesday, January 28, 2014
BLS: State unemployment rates were "generally lower" in December
From the BLS: Regional and State Employment and Unemployment Summary
Regional and state unemployment rates were generally lower in December. Thirty-nine states and the District of Columbia had unemployment rate decreases from November, two states had increases, and nine states had no change, the U.S. Bureau of Labor Statistics reported today.
...
Rhode Island had the highest unemployment rate among the states in December, 9.1 percent. The next highest rates were in Nevada, 8.8 percent, and Illinois, 8.6 percent. North Dakota continued to have the lowest jobless rate, 2.6 percent.
 Click on graph for larger image.
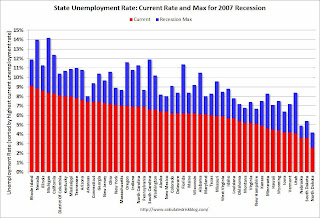
This graph shows the current unemployment rate for each state (red), and the max during the recession (blue). All states are below the maximum unemployment rate for the recession.
The size of the blue bar indicates the amount of improvement - Michigan, Nevada and Florida have seen the largest declines and many other states have seen significant declines.
The states are ranked by the highest current unemployment rate. No state has double digit unemployment and the unemployment rate is at 9% in only one state: Rhode Island.
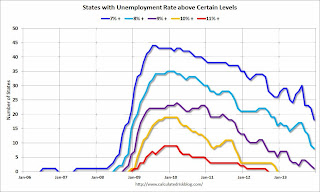
 The second graph shows the number of states with unemployment rates above certain levels since January 2006. At the worst of the employment recession, there were 9 states with an unemployment rate above 11% (red).
Currently one state has an unemployment rate at or above 9% (purple), eight states at or above 8% (light blue), and 18 states at or above 7% (blue).
Case-Shiller: Comp 20 House Prices increased 13.7% year-over-year in November
by Calculated Risk on 1/28/2014 09:00:00 AM
S&P/Case-Shiller released the monthly Home Price Indices for November ("November" is a 3 month average of September, October and November prices).
This release includes prices for 20 individual cities, and two composite indices (for 10 cities and 20 cities).
Note: Case-Shiller reports Not Seasonally Adjusted (NSA), I use the SA data for the graphs.
From S&P: Winter Shows No Signs of Cooling in Home Prices According to the S&P/Case-Shiller Home Price Indices
Data through November 2013, released today by S&P Dow Jones Indices for its S&P/Case-Shiller Home Price Indices ... showed that the 10-City and 20-City Composites increased 13.8% and 13.7% year-over-year. Dallas posted its highest annual return of 9.9% since its inception in 2000. Chicago also stood out with an annual rate of 11.0%, its highest since December 1988.
For the month of November, the two Composites declined 0.1%. After nine consecutive months of gains, this marks the first decrease since November 2012. Nine out of 20 cities recorded positive monthly returns ...
“November was a good month for home prices,” says David M. Blitzer, Chairman of the Index Committee at S&P Dow Jones Indices. “Despite the slight decline, the 10-City and 20-City Composites showed their best November performance since 2005. Prices typically weaken as we move closer to the winter. Las Vegas, Los Angeles and Phoenix stand out as they have posted 20 or more consecutive monthly gains.
“Beginning June 2012, we saw a steady rise in year-over-year increases. November continued that trend with another strong month although the rate of increase slowed. Looking at the year-over-year returns, the Sun Belt continues to push ahead with Atlanta, Las Vegas, Los Angeles, Miami, Phoenix, San Diego, San Francisco and Tampa taking eight of the top nine spots. Detroit continues to recover but remains the only city with prices below its 2000 level."
 Click on graph for larger image.
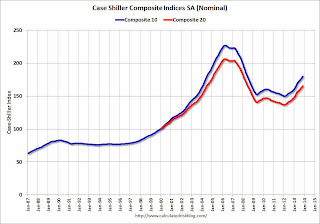
 The first graph shows the nominal seasonally adjusted Composite 10 and Composite 20 indices (the Composite 20 was started in January 2000).
The Composite 10 index is off 20.8% from the peak, and up 0.9% in November (SA). The Composite 10 is up 20.1% from the post bubble low set in Jan 2012 (SA).
The Composite 20 index is off 19.9% from the peak, and up 0.9% (SA) in November. The Composite 20 is up 20.8% from the post-bubble low set in Jan 2012 (SA).
 The second graph shows the Year over year change in both indices.
The Composite 10 SA is up 13.9% compared to November 2012.
The Composite 20 SA is up 13.7% compared to November 2012.
Prices increased (SA) in 20 of the 20 Case-Shiller cities in November seasonally adjusted. (Prices increased in 9 of the 20 cities NSA) Prices in Las Vegas are off 45.8% from the peak, and prices in Denver and Dallas are at new highs (SA).
This was at the consensus forecast for a 13.7% YoY increase. I'll have more on prices later.
Black Knight: Mortgage Delinquency Rate increased in December, Down almost 10% year-over-year
by Calculated Risk on 1/28/2014 07:01:00 AM
According to the Black Knight (formerly LPS) First Look report for December, the percent of loans delinquent increased seasonally in December compared to November, and declined about 9.9% year-over-year.
Also the percent of loans in the foreclosure process declined further in December and were down 28% over the last year.
Black Knight reported the U.S. mortgage delinquency rate (loans 30 or more days past due, but not in foreclosure) increased to 6.47% from 6.45% in November. The normal rate for delinquencies is around 4.5% to 5%.
The percent of loans in the foreclosure process declined to 2.48% in December from 2.50% in November. The is the lowest level since late 2008.
The number of delinquent properties, but not in foreclosure, is down 332,000 properties year-over-year, and the number of properties in the foreclosure process is down 472,000 properties year-over-year.
Black Knight will release the complete mortgage monitor for December in early February.
| Black Knight: Percent Loans Delinquent and in Foreclosure Process | |||
|---|---|---|---|
| December 2013 | November 2013 | December 2012 | |
| Delinquent | 6.47% | 6.45% | 7.17% |
| In Foreclosure | 2.48% | 2.50% | 3.44% |
| Number of properties: | |||
| Number of properties that are 30 or more, and less than 90 days past due, but not in foreclosure: | 1,964,000 | 1,958,000 | 2,031,000 |
| Number of properties that are 90 or more days delinquent, but not in foreclosure: | 1,280,000 | 1,283,000 | 1,545,000 |
| Number of properties in foreclosure pre-sale inventory: | 1,244,000 | 1,256,000 | 1,716,000 |
| Total Properties | 4,488,000 | 4,497,000 | 5,292,000 |
Monday, January 27, 2014
Tuesday: Case-Shiller House Prices, Durable Goods, Richmond Fed Mfg Survey and More
by Calculated Risk on 1/27/2014 08:34:00 PM
Notes: I follow several house price indexes (Case-Shiller, CoreLogic, LPS, Zillow, FHFA, FNC and more). The timing of different house prices indexes can be a little confusing. LPS uses the current month closings only (not a three month average like Case-Shiller or a weighted average like CoreLogic), excludes short sales and REOs, and is not seasonally adjusted.
From Black Knight (formerly LPS): U.S. Home Prices Up 0.3 Percent for the Month; Up 8.5 Percent Year-Over-Year
oday, the Data & Analytics division of Black Knight Financial Services (formerly the LPS Data & Analytics division) released its latest Home Price Index (HPI) report, based on November 2013 residential real estate transactions. The Black Knight HPI combines the company’s extensive property and loan-level databases to produce a repeat sales analysis of home prices as of their transaction dates every month for each of more than 18,500 U.S. ZIP codes. The Black Knight HPI represents the price of non-distressed sales by taking into account price discounts for REO and short sales.The year-over-year increase was slightly less in November than in October. The LPS HPI is off 13.9% from the peak in June 2006.
Tuesday:
• At 8:30 AM ET, the Durable Goods Orders report for December from the Census Bureau. The consensus is for a 1.6% increase in durable goods orders.
• At 9:00 AM, the S&P/Case-Shiller House Price Index for November. The consensus is for a 13.7% year-over-year increase in the Composite 20 index (NSA) for August.
• Also at 9:00 AM, the Chemical Activity Barometer (CAB) for January from the American Chemistry Council. This appears to be a leading economic indicator.
• At 10:00 AM, the Conference Board's consumer confidence index for January. The consensus is for the index to increase to 79.0 from 78.1.
• Also at 10:00 AM, Richmond Fed Survey of Manufacturing Activity for January. This is the last of the regional Fed surveys for January. The consensus is a reading of 10, down from 13 in December (above zero is expansion).
• Also at 10:00 AM, Regional and State Employment and Unemployment (Monthly) for December 2013.
Weekly Update: Housing Tracker Existing Home Inventory up 1.8% year-over-year on Jan 27th
by Calculated Risk on 1/27/2014 05:30:00 PM
Here is another weekly update on housing inventory ... for the 15th consecutive week housing inventory is up year-over-year (but not by much). This suggests inventory bottomed early in 2013.
There is a clear seasonal pattern for inventory, with the low point for inventory in late December or early January, and then peaking in mid-to-late summer.
The Realtor (NAR) data is monthly and released with a lag (the most recent data was for December). However Ben at Housing Tracker (Department of Numbers) has provided me some weekly inventory data for the last several years.
 Click on graph for larger image.
This graph shows the Housing Tracker reported weekly inventory for the 54 metro areas for 2010, 2011, 2012, 2013 and 2014.
In 2011 and 2012, inventory only increased slightly early in the year and then declined significantly through the end of each year.
Inventory in 2014 is now 1.8% above the same week in 2013 (red is 2014, blue is 2013).
Inventory is still very low - and barely up year-over-year - but this increase in inventory should slow house price increases.
Note: One of the key questions for 2014 will be: How much will inventory increase? My guess is inventory will be up 10% to 15% year-over-year by the end of 2014 (inventory would still be below normal).


