by Calculated Risk on 1/31/2014 05:21:00 PM
Friday, January 31, 2014
Reinhart and Rogoff: Great Recession may "surpass in severity" the Great Depression in many Countries
A new paper from Reinhart and Rogoff: Recovery from Financial Crisis: Evidence from 100 Episodes. Excerpt:
Examining the evolution of real per capita GDP around 100 systemic banking crises reveals that a significant part of the costs of these crises lies in the protracted and halting nature of the recovery. On average it takes about eight years to reach the pre-crisis level of income; the median is about 6 ½ years. Five to six years after the onset of the current crisis only Germany and the US (out of 12 systemic crisis cases) have reached their 2007-2008 peaks in per capita income. In a sample that covers 63 crises in advanced economies and 37 in larger emerging markets, more than forty percent of the post-crisis episodes experienced double dips. The analysis summarized here adds another dimension to an observation we have been emphasizing on the basis of our earlier work—namely, that the subprime crisis is not an anomaly in the context of the pre-WWII era. Postwar business cycles are not the right comparator for the severe crises that have swept advanced economies in recent years.The policies of austerity in Europe have failed miserably and many countries there are experiencing a worse slump than during the Depression (austerity in the US has held back the recovery too, but at least there was a little stimulus in 2009, and monetary policy was accommodative). As Reinhart and Rogoff note, higher inflation in Europe (and the US) would help.
...
Even after one of the most severe multi-year crises on record in the advanced economies, the received wisdom in policy circles clings to the notion that high-income countries are completely different from their emerging-market counterparts. The current phase of the official policy approach is predicated on the assumption that growth, financial stability and debt sustainability can be achieved through a mix of austerity and forbearance (and some reform). The claim is that advanced countries do not need to resort to the more eclectic policies of emerging markets, including debt restructurings and conversions, higher inflation, capital controls and other forms of financial repression. Now entering the sixth or seventh year (depending on the country) of crisis, output remains well below its pre-crisis peak in ten of the twelve crisis countries. The gap with potential output is even greater. Delays in accepting that desperate times call for desperate measures keeps raising the odds that, as documented here, this crisis may in the end surpass in severity the depression of the 1930s in a large number of countries.
emphasis added
Hotel Occupancy Rate increased 2.4% year-over-year in latest Survey
by Calculated Risk on 1/31/2014 01:48:00 PM
From HotelNewsNow.com: STR: US results for week ending 25 January
The U.S. hotel industry posted positive results in the three key performance measurements during the week of 19-25 January 2014, according to data from STR.The 4-week average of the occupancy rate is close to normal levels.
In year-over-year measurements, the industry’s occupancy increased 2.4 percent to 55.2 percent. Average daily rate rose 3.0 percent to finish the week at US$109.59. Revenue per available room for the week was up 5.5 percent to finish at US$60.54.
emphasis added
Note: ADR: Average Daily Rate, RevPAR: Revenue per Available Room.
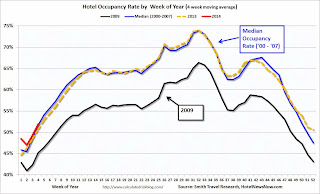
The following graph shows the seasonal pattern for the hotel occupancy rate using the four week average.
 Click on graph for larger image.
The red line is for 2014 and black is for 2009 - the worst year since the Great Depression for hotels.
Through January 25th, the 4-week average of the occupancy rate is slightly higher than the same period last year and is tracking at pre-recession levels.
This is expected to be another solid year for the hotel industry. In response to the improved metrics, the AIA expects hotel construction to increase significantly in 2014: Nonresidential Building Activity Projected to Accelerate in 2014
Led by the hotel ... the commercial sector looks to see the biggest gains in construction spending, with demand for institutional projects increasing at a more moderate level.Data Source: Smith Travel Research, Courtesy of HotelNewsNow.com
...
“Since the overall economy is stabilizing, there should be a significant improvement in the outlook for the construction industry that has been recovering at a slow and steady pace the last two years,” said AIA Chief Economist, Kermit Baker, PhD, Hon. AIA. “At a more granular level, the surging housing market, growing commercial property values, and declining office and retail vacancies are all contributing to what is expected to amount to a much greater spending on nonresidential building projects.”
HVS: Q4 2013 Homeownership and Vacancy Rates
by Calculated Risk on 1/31/2014 11:32:00 AM
The Census Bureau released the Housing Vacancies and Homeownership report for Q4 2013 this morning.
This report is frequently mentioned by analysts and the media to track the homeownership rate, and the homeowner and rental vacancy rates. However, there are serious questions about the accuracy of this survey.
This survey might show the trend, but I wouldn't rely on the absolute numbers. The Census Bureau is investigating the differences between the HVS, ACS and decennial Census, and analysts probably shouldn't use the HVS to estimate the excess vacant supply or household formation, or rely on the homeownership rate,except as a guide to the trend.
 Click on graph for larger image.
The Red dots are the decennial Census homeownership rates for April 1st 1990, 2000 and 2010. The HVS homeownership rate decreased to 65.2% in Q4, from 65.3% in Q3.
I'd put more weight on the decennial Census numbers and that suggests the actual homeownership rate is probably in the 64% to 65% range - and given changing demographics, the homeownership rate is probably close to a bottom.
 The HVS homeowner vacancy increased to 2.1% in Q4.
It isn't really clear what this means. Are these homes becoming rentals?
Once again - this probably shows that the general trend is down, but I wouldn't rely on the absolute numbers.
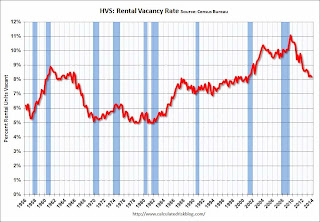
 The rental vacancy rate decreased slightly in Q4 to 8.2% from 8.3% in Q3.
I think the Reis quarterly survey (large apartment owners only in selected cities) is a much better measure of the rental vacancy rate - and Reis reported that the rental vacancy rate is at the lowest level since 2001 - and might be close to a bottom.
The quarterly HVS is the most timely survey on households, but there are many questions about the accuracy of this survey. Unfortunately many analysts still use this survey to estimate the excess vacant supply. However this does suggest that most of the bubble excess is behind us.
Final January Consumer Sentiment at 81.2, Chicago PMI at 59.6
by Calculated Risk on 1/31/2014 09:55:00 AM

Click on graph for larger image.
• The final Reuters / University of Michigan consumer sentiment index for January decreased to 81.2 from the December reading of 82.5, but up from the preliminary January reading of 80.4.
This was just above the consensus forecast of 81.0. Sentiment has generally been improving following the recession - with plenty of ups and downs - and a big spike down when Congress threatened to "not pay the bills" in 2011, and another smaller spike down last October and November due to the government shutdown.
I expect to see sentiment at post-recession highs very soon.
• From the Chicago ISM:
January 2014:
The Chicago Business Barometer softened to 59.6 in January from a revised 60.8 in December, the third consecutive monthly fall following October’s jump to the highest since March 2011. In spite of January’s slower rate of expansion, the Barometer remained firm and consistent with the recent pick-up in GDP.This was close to the consensus estimate of 59.5.
...
Commenting on the MNI Chicago Report, Philip Uglow, Chief Economist at MNI Indicators said, “Business activity continued to ease in January but remained at a relatively high level. Production and New Orders remained firm, and while Employment fell back into contraction, this doesn‘t appear to be indicative of current demand conditions.”
“There have been concerns that putting the brakes on monetary easing could damage business. Most respondents, though, thought that the Federal Reserve’s decision to begin tapering their bond purchases in December would not have a significant impact on their business”, he added
BEA: Personal Income increased less than 0.1% in December, Core PCE prices up 1.2% year-over-year
by Calculated Risk on 1/31/2014 08:30:00 AM
The BEA released the Personal Income and Outlays report for December:
Personal income increased $2.3 billion, or less than 0.1 percent ... in December according to the Bureau of Economic Analysis. Personal consumption expenditures (PCE) increased $44.1 billion, or 0.4 percent.A key point is that the PCE price index was only up 1.1% year-over-year (1.2% for core PCE). PCE increased at a 2.5% in December, but core PCE only increased at a 1.1% annualized rate in December (Well below the Fed's target).
...
Real PCE -- PCE adjusted to remove price changes -- increased 0.2 percent in December, compared with an increase of 0.6 percent in November. ... PCE price index -- The price index for PCE increased 0.2 percent in December, compared with an increase of less than 0.1 percent in November. The PCE price index, excluding food and energy, increased 0.1 percent in December, the same increase as in November.
...
Personal saving -- DPI less personal outlays -- was $495.2 billion in December, compared with $541.0 billion in November. The personal saving rate -- personal saving as a percentage of disposable personal income -- was 3.9 percent in December, compared with 4.3 percent in November.


