by Calculated Risk on 2/05/2014 10:00:00 AM
Wednesday, February 05, 2014
ISM Non-Manufacturing Index increases to 54.0 in January
The January ISM Non-manufacturing index was at 54.0%, up from 53.0% in December. The employment index increased in January to 56.4%, up from 55.6% in December. Note: Above 50 indicates expansion, below 50 contraction.
From the Institute for Supply Management: January 2014 Non-Manufacturing ISM Report On Business®
Economic activity in the non-manufacturing sector grew in January for the 48th consecutive month, say the nation's purchasing and supply executives in the latest Non-Manufacturing ISM Report On Business®.
The report was issued today by Anthony Nieves, CPSM, C.P.M., CFPM, chair of the Institute for Supply Management® Non-Manufacturing Business Survey Committee. "The NMI® registered 54 percent in January, 1 percentage point higher than the seasonally adjusted reading of 53 percent registered in December. The Non-Manufacturing Business Activity Index increased to 56.3 percent, which is 2 percentage points higher than the seasonally adjusted reading of 54.3 percent reported in December, reflecting growth for the 54th consecutive month and at a faster rate. The New Orders Index increased to 50.9 percent, 0.5 percentage point higher than the seasonally adjusted reading of 50.4 registered in December. The Employment Index increased 0.8 percentage point to 56.4 percent from the December seasonally adjusted reading of 55.6 percent and indicates growth in employment for the 25th consecutive month and at a faster rate. The Prices Index increased 2.4 percentage points from the December seasonally adjusted reading of 54.7 percent to 57.1 percent, indicating prices increased at a faster rate in January when compared to December. According to the NMI®, eleven non-manufacturing industries reported growth in January. The majority of respondents' comments reflect an improvement in business conditions. Some of the respondents indicate that weather conditions have impacted their business. There remains a bit of uncertainty about the overall economy for some of the survey respondents; however, the majority feel positive about continued economic growth."
emphasis added
 Click on graph for larger image.
This graph shows the ISM non-manufacturing index (started in January 2008) and the ISM non-manufacturing employment diffusion index.
This was close to the consensus forecast of 53.9% and indicates faster expansion in January than in December.
The increase in the new orders index and the stronger employment index are positives.
ADP: Private Employment increased 175,000 in January
by Calculated Risk on 2/05/2014 08:20:00 AM
Private sector employment increased by 175,000 jobs from December to January according to the January ADP National Employment Report®. ... The report, which is derived from ADP’s actual payroll data, measures the change in total nonfarm private employment each month on a seasonally-adjusted basis.This was at the consensus forecast for 170,000 private sector jobs added in the ADP report.
...
Mark Zandi, chief economist of Moody’s Analytics, said, "Cold and stormy winter weather continued to weigh on the job numbers. Underlying job growth, abstracting from the weather, remains sturdy. Gains are broad based across industries and company sizes, the biggest exception being manufacturing, which shed jobs, but that is not expected to continue.”
Note: ADP hasn't been very useful in directly predicting the BLS report on a monthly basis, but it might provide a hint. The BLS report for January will be released on Friday.
MBA: Mortgage Applications Increase Slightly
by Calculated Risk on 2/05/2014 07:03:00 AM
From the MBA: Mortgage Applications Increase Slightly in Latest MBA Weekly Survey
Mortgage applications increased 0.4 percent from one week earlier, according to data from the Mortgage Bankers Association’s (MBA) Weekly Mortgage Applications Survey for the week ending January 31, 2014. ...
The Refinance Index increased 3 percent from the previous week. The seasonally adjusted Purchase Index decreased 4 percent from one week earlier. ...
...
The average contract rate declined for all loan products in the survey. Contract rates were at their lowest level since November 2013, except for the 5/1 ARM, which was at the lowest level since December 2013.
The average contract interest rate for 30-year fixed-rate mortgages with conforming loan balances ($417,000 or less) decreased to 4.47 percent from 4.52 percent, with points decreasing to 0.25 from 0.40 (including the origination fee) for 80 percent loan-to-value ratio (LTV) loans.
emphasis added
 Click on graph for larger image.
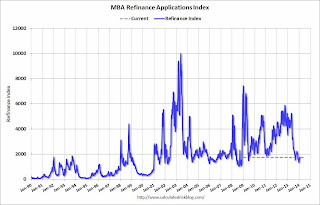
The first graph shows the refinance index.
The refinance index is down 67% from the levels in May 2013.
With the mortgage rate increases, refinance activity will be significantly lower in 2014 than in 2013.
 The second graph shows the MBA mortgage purchase index.
 The 4-week average of the purchase index is now down about 14% from a year ago.
The purchase index is probably understating purchase activity because small lenders tend to focus on purchases, and those small lenders are underrepresented in the purchase index.
Tuesday, February 04, 2014
Wednesday: ADP Employment, ISM Service Index
by Calculated Risk on 2/04/2014 07:47:00 PM
Here is an optimistic outlook from NAHB economist David Crowe:
"My single-family forecast for 2014 is pretty aggressive--822,000 starts which is likely 200,000 more than 2013," said NAHB Chief Economist David Crowe. "There are five key points to the turnaround. Consumers are back, pent-up demand is emerging, there is a growing need for new construction, distressed sales are diminishing and builders see it."For 2012, Crowe forecast 360 thousand new home sales (actual was 368 thousand) and 501 single family starts (actual was 535 thousand). For 2013, Crowe forecast 447 thousand new home sales (actual was 428 thousand), and 641 thousand single family starts (actual was 618 thousand). So he has been pretty close ... but his 2014 forecast is "pretty aggressive"!
Consumer confidence has returned to pre-recession levels and household balance sheets are on the mend. ...
Meanwhile, new-home sales are averaging just 8.7 percent of total home sales, barely half the historical average of 16.1 percent. ...
NAHB is forecasting 1.15 million total housing starts in 2014, up 24.5 percent from last year's total of 928,000 units.
Single-family production is projected to rise 32 percent in 2014 to 822,000 units and surge an additional 41 percent to 1.16 million units next year.
NAHB is anticipating 333,000 multifamily starts in 2014, up 9 percent from 306,000 last year.
Single-family home sales are projected to hit 584,000 this year, a 35.9 percent increase above last year's 430,000 sales
Wednesday:
• At 7:00 AM ET, the Mortgage Bankers Association (MBA) will release the results for the mortgage purchase applications index.
• At 8:15 AM, the ADP Employment Report for January. This report is for private payrolls only (no government). The consensus is for 170,000 payroll jobs added in January, down from 238,000 in December.
• At 10:00 AM, the ISM non-Manufacturing Index for January. The consensus is for a reading of 53.9, up from 53.0 in December. Note: Above 50 indicates expansion, below 50 contraction.
Q4 2013 GDP Details on Residential and Commercial Real Estate
by Calculated Risk on 2/04/2014 05:14:00 PM
The BEA released the underlying details for the Q4 advance GDP report.
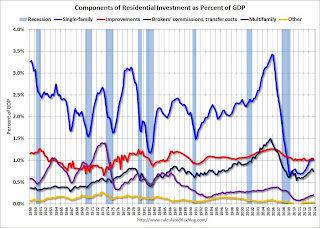
The first graph is for Residential investment (RI) components as a percent of GDP. According to the Bureau of Economic Analysis, RI includes new single family structures, multifamily structures, home improvement, Brokers’ commissions and other ownership transfer costs, and a few minor categories (dormitories, manufactured homes).
A few key points:
1) Usually the most important components are investment in single family structures followed by home improvement. However home improvement has been the top category for twenty one consecutive quarters, but that is about to change. Investment in single family structures should be the top category again soon.
2) Even though investment in single family structures has increased significantly from the bottom, single family investment is still very low - and still below the bottom for previous recessions. I expect further increases over the next few years.
3) Look at the contribution from Brokers’ commissions and other ownership transfer costs. This is the category mostly related to existing home sales (this is the contribution to GDP from existing home sales). If existing home sales are flat, or even decline due to fewer foreclosures, this will have little impact on total residential investment.
 Click on graph for larger image.
Investment in home improvement was at a $177 billion Seasonally Adjusted Annual Rate (SAAR) in Q4 (about 1.0% of GDP), still above the level of investment in single family structures of $174 billion (SAAR) (also 1.0% of GDP). Single family structure investment will probably overtake home improvement as the largest category of residential investment very soon.
The second graph shows investment in offices, malls and lodging as a percent of GDP. Office, mall and lodging investment has increased recently, but from a very low level.
Investment in offices is down about 53% from the recent peak (as a percent of GDP). There has been some increase in the Architecture Billings Index lately, so office investment might start to increase. However the office vacancy rate is still very high, so any increase in investment will probably be small.
 Investment in multimerchandise shopping structures (malls) peaked in 2007 and is down about 56% from the peak (note that investment includes remodels, so this will not fall to zero). The vacancy rate for malls is still very high, so investment will probably stay low for some time.
Lodging investment peaked at 0.31% of GDP in Q3 2008 and is down about 64%. With the hotel occupancy rate close to normal, it is possible that hotel investment will probably continue to increase.
These graphs show there is currently very little investment in offices, malls and lodging - but that investment is starting to increase. And residential investment is increasing, but from a very low level.


