by Calculated Risk on 2/20/2014 02:59:00 PM
Thursday, February 20, 2014
MBA National Delinquency Survey: Judicial vs. Non-Judicial Foreclosure States in Q4 2013
Earlier I posted the MBA National Delinquency Survey press release and a graph that showed mortgage delinquencies and foreclosures by period past due. There is a clear downward trend for mortgage delinquencies, however some states are further along than others. From the press release:
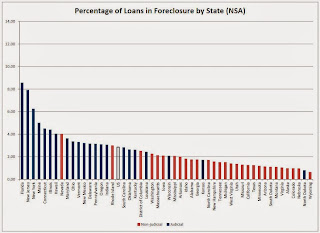
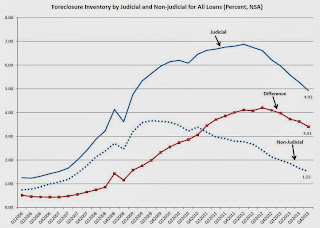
States with judicial foreclosure systems still account for most of the loans in foreclosure. Of the 17 states that had a higher foreclosure inventory rate than the national average, 15 were judicial states. While the percentage of loans in foreclosure dropped in both judicial and nonjudicial states, the average rate for judicial states was 4.92 percent compared to the average rate of 1.52 percent for nonjudicial states. That being said, for judicial states this was still a significant improvement from the rate of 6.88 percent recorded in 2012.
 Click on graph for larger image.
This graph is from the MBA and shows the percent of loans in the foreclosure process by state. Posted with permission. Blue is for judicial foreclosure states, and red for non-judicial foreclosure states.
The top states are Florida (8.56% in foreclosure down from 9.48% in Q3), New Jersey (7.90% down from 8.28%), New York (6.24% down from 6.34%), and Maine (5.00% down from 5.44%). Nevada is the only non-judicial state in the top 10, and this is partially due to state laws that slow foreclosures.
California (1.25% down from 1.42%) and Arizona (1.12% down from 1.26%) are now far below the national average by every measure.
 For judicial foreclosure states, foreclosure inventory peaked in Q2 2012 (foreclosure inventory is the number of mortgages in the foreclosure process). Foreclosure inventory in the judicial states has declined for six consecutive quarters. This was three years after the peak in foreclosure inventories for non-judicial states.
It looks like the judicial states will have a significant number of distressed sales for a few more years - however the non-judicial states are closer to normal levels.
Key Measures Shows Low Inflation in January
by Calculated Risk on 2/20/2014 12:30:00 PM
The Cleveland Fed released the median CPI and the trimmed-mean CPI this morning:
According to the Federal Reserve Bank of Cleveland, the median Consumer Price Index rose 0.2% (2.2% annualized rate) in January. The 16% trimmed-mean Consumer Price Index increased 0.1% (1.5% annualized rate) during the month. The median CPI and 16% trimmed-mean CPI are measures of core inflation calculated by the Federal Reserve Bank of Cleveland based on data released in the Bureau of Labor Statistics' (BLS) monthly CPI report.Note: The Cleveland Fed has the median CPI details for January here. The price for fuel oil and other fuels increased sharply in January, but prices for motor fuels declined.
Earlier today, the BLS reported that the seasonally adjusted CPI for all urban consumers rose 0.1% (1.7% annualized rate) in January. The CPI less food and energy increased 0.1% (1.5% annualized rate) on a seasonally adjusted basis.
 Click on graph for larger image.
This graph shows the year-over-year change for these four key measures of inflation. On a year-over-year basis, the median CPI rose 2.0%, the trimmed-mean CPI rose 1.6%, and the CPI less food and energy rose 1.6%. Core PCE is for December and increased just 1.2% year-over-year.
On a monthly basis, median CPI was at 2.2% annualized, trimmed-mean CPI was at 1.5% annualized, and core CPI increased 1.5% annualized.
These measures suggest inflation remains below the Fed's target.
MBA: Mortgage "Delinquency and Foreclosure Rates Decline to Lowest Level in Six Years" in Q4
by Calculated Risk on 2/20/2014 10:38:00 AM
From the MBA: Delinquency and Foreclosure Rates Decline to Lowest Level in Six Years
The delinquency rate for mortgage loans on one-to-four-unit residential properties decreased to a seasonally adjusted rate of 6.39 percent of all loans outstanding at the end of the fourth quarter of 2013, the lowest level since the first quarter of 2008. The delinquency rate decreased two basis points from the previous quarter, and 70 basis points from one year ago, according to the Mortgage Bankers Association’s (MBA) National Delinquency Survey.
The delinquency rate includes loans that are at least one payment past due but does not include loans in the process of foreclosure. The percentage of loans in the foreclosure process at the end of the fourth quarter was 2.86 percent, down 22 basis points from the third quarter and 88 basis points lower than one year ago. This was the lowest foreclosure inventory rate seen since 2008.
...
“We continue to see substantial improvement in both delinquency and foreclosure rates, with most measures now back to pre-crisis levels,” said Michael Fratantoni, MBA’s Chief Economist and Senior Vice President of Research and Industry Technology. “The delinquency rate, at 6.39 percent, is more than 3 percentage points lower than its peak of over 10 percent in 2010 and is edging closer to the historical average of around 5 percent. The percentage of loans in foreclosure has fallen for the seventh consecutive quarter, decreasing to 2.86 percent, the lowest level in six years. The percentage of new foreclosures started, at 0.54 percent, is the lowest in eight years and is back within its typical historical range.
“There was broad improvement in foreclosure rates in the fourth quarter, with 49 states and the District of Columbia recording a decrease. Florida still leads the nation in the percentage of loans in foreclosure, but that percentage has fallen to 8.56 percent from a peak of 14.5 percent. New Jersey and New York had the next two highest rates but both states did see a drop from the previous quarter. States with judicial foreclosure systems still account for most of the loans in foreclosure. Of the 17 states that had a higher foreclosure inventory rate than the national average, 15 were judicial states. While the percentage of loans in foreclosure dropped in both judicial and nonjudicial states, the average rate for judicial states was 4.92 percent compared to the average rate of 1.52 percent for nonjudicial states. That being said, for judicial states this was still a significant improvement from the rate of 6.88 percent recorded in 2012."
emphasis added
 Click on graph for larger image.
This graph shows the percent of loans delinquent by days past due.
Loans 30 days delinquent increased to 2.89% from 2.79% in Q3. This is close to the long term average.
Delinquent loans in the 60 day bucket decreased to 1.06% in Q4, from 1.07% in Q3. This is still slightly elevated.
The 90 day bucket decreased to 2.45% from 2.56%. This is still way above normal (around 0.8% would be normal according to the MBA).
The percent of loans in the foreclosure process decreased to 2.86% from 3.08% and is now at the lowest level since 2008.
Most of the poor performing loans were originated in 2007 or earlier, from the MBA's Fratantoni:
“Loan cohorts from 2009 and earlier continue to make up more than 90 percent of seriously delinquent loans. Loans originated in 2007 and earlier accounted for 75 percent of the seriously delinquent loans, while loans originated in 2008 and 2009 accounted for another 16 percent."This survey has shown steady improvement in delinquency and foreclosure rates, but it will take a few more years to work through the backlog - especially in judicial foreclosure states.
Philly Fed Manufacturing Survey indicates Contraction in February
by Calculated Risk on 2/20/2014 10:00:00 AM
From the Philly Fed: February Manufacturing Survey
The survey’s broadest measure of manufacturing conditions, the diffusion index of current activity, decreased from a reading of 9.4 in January to ‐6.3 this month. This was the first negative reading of the index in nine months.This was well below the consensus forecast of a reading of 10.0 for February.
...
The current employment index remained positive for the eighth consecutive month but declined 5 points from January.
emphasis added
Also Market released their Flash PMI for February this morning that suggests faster manufacturing expansion:
February data suggested a solid rebound in U.S. manufacturing business conditions following the slowdown recorded during the previous month. This was highlighted by a rise in the Markit Flash U.S. Manufacturing Purchasing Managers’ Index™ (PMI™), which is based on approximately 85% of usual monthly replies, from 53.7 in January to 56.7 in February. The latest reading pointed to the fastest overall improvement in U.S. manufacturing business conditions since May 2010.
Commenting on the flash PMI data, Chris Williamson, Chief Economist at Markit said:
“The flash manufacturing PMI provides the first indications that production has rebounded from the weather - related slowdown seen in January . Having slumped to a three - month low in January the PMI surged to its highest for almost four years in February, as companies reported business returning to normal after freezing temperatures and snow disrupted operations and supply chains.
“Hiring also picked up to the fastest since last March, with the survey signalling approximately 15,000 jobs being created in February.
“While the strong PMI reading in part represents a rebound from the temporary weakness seen at the start of the year, further growth looks likely in coming months, suggesting the underlying health of the economy remain s robust. In particular, February saw the largest rise in backlogs of work seen since prior to the financial crisis, as well as a further steep fall in inventories of finished goods. Both point to ongoing growth of production and hiring in March.”
emphasis added
Weekly Initial Unemployment Claims decrease to 336,000
by Calculated Risk on 2/20/2014 08:33:00 AM
The DOL reports:
In the week ending February 15, the advance figure for seasonally adjusted initial claims was 336,000, a decrease of 3,000 from the previous week's unrevised figure of 339,000. The 4-week moving average was 338,500, an increase of 1,750 from the previous week's unrevised average of 336,750.The previous week was unrevised.
The following graph shows the 4-week moving average of weekly claims since January 2000.
 Click on graph for larger image.
The dashed line on the graph is the current 4-week average. The four-week average of weekly unemployment claims increased to 338,500.
This was close to the consensus forecast of 335,000. Mostly moving sideways ...


