by Calculated Risk on 2/26/2014 01:27:00 PM
Wednesday, February 26, 2014
New Home Sales: Don't read too much into January Sales Rate
Earlier: New Home Sales at 468,000 Annual Rate in January, Highest since 2008
Even though the Census Bureau reported that new home sales rebounded in January from the low December rate (and the December sales rate was revised up), January and December are seasonally weak months - and there is a large margin of error to the initial release - so I wouldn't read too much into one month of data. Also reported sales were only up 2% year-over-year (not much).
In 2013, January was reported as the strongest sales rate of the year - so maybe the seasonal factor is off a little. So even though this was a decent start to 2014 (highest sales rate since 2008), the key months are ahead of us.
Note: Based on estimates of household formation and demographics, I expect sales to increase to 750 to 800 thousand over the next several years - substantially higher than the 468 thousand sales rate in January. So I expect the housing recovery to continue.
And here is another update to the "distressing gap" graph that I first started posting over four years ago to show the emerging gap caused by distressed sales. Now I'm looking for the gap to close over the next few years.
 Click on graph for larger image.
The "distressing gap" graph shows existing home sales (left axis) and new home sales (right axis) through January 2014. This graph starts in 1994, but the relationship has been fairly steady back to the '60s.
Following the housing bubble and bust, the "distressing gap" appeared mostly because of distressed sales. The flood of distressed sales kept existing home sales elevated, and depressed new home sales since builders weren't able to compete with the low prices of all the foreclosed properties.
I expect existing home sales to decline some (distressed sales will slowly decline and be partially offset by more conventional sales). And I expect this gap to close - mostly from an increase in new home sales.
 Another way to look at this is a ratio of existing to new home sales.
This ratio was fairly stable from 1994 through 2006, and then the flood of distressed sales kept the number of existing home sales elevated and depressed new home sales. (Note: This ratio was fairly stable back to the early '70s, but I only have annual data for the earlier years).
In general the ratio has been trending down - and is currently at the lowest level since November 2008. I expect this ratio to continue to trend down over the next several years as the number of distressed sales declines and new home sales increase.
Note: Existing home sales are counted when transactions are closed, and new home sales are counted when contracts are signed. So the timing of sales is different.
FDIC: Earnings increased for insured institutions, Fewer Problem banks, Residential REO Declines in Q4
by Calculated Risk on 2/26/2014 11:30:00 AM
The FDIC released the Quarterly Banking Profile for Q4 today.
Commercial banks and savings institutions insured by the Federal Deposit Insurance Corporation (FDIC) reported aggregate net income of $40.3 billion in the fourth quarter of 2013, a $5.8 billion (16.9 percent) increase from the $34.4 billion in earnings that the industry reported a year earlier. This is the 17th time in the last 18 quarters — since the third quarter of 2009 — that earnings have registered a year-over-year increase. The improvement in earnings was mainly attributable to an $8.1 billion decline in loan-loss provisions. Lower income stemming from reduced mortgage activity and a drop in trading revenue contributed to a year-over-year decline in net operating revenue (the sum of net interest income and total noninterest income). More than half of the 6,812 insured institutions reporting (53 percent) had year-over-year growth in quarterly earnings. The proportion of banks that were unprofitable fell to 12.2 percent, from 15 percent in the fourth quarter of 2012.The FDIC reported the number of problem banks declined:
emphasis added
The number of "problem banks" fell for the 11th consecutive quarter. The number of banks on the FDIC's "Problem List" declined from 515 to 467 during the quarter. The number of "problem" banks is down by almost half from the recent high of 888 at the end of the first quarter of 2011. Two FDIC-insured institutions failed in the fourth quarter of 2013, down from eight in the fourth quarter of 2012. For all of 2013, there were 24 failures, compared to 51 in 2012.
 Click on graph for larger image.
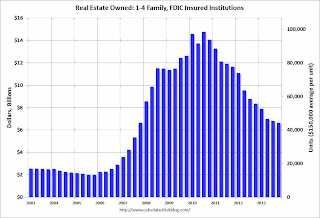
The dollar value of 1-4 family residential Real Estate Owned (REOs, foreclosure houses) declined from $6.79 billion in Q3 2013 to $6.64 billion in Q4. This is the lowest level of REOs since Q3 2007. Even in good times, the FDIC insured institutions have about $2.5 billion in residential REO.
This graph shows the dollar value of Residential REO for FDIC insured institutions. Note: The FDIC reports the dollar value and not the total number of REOs.
New Home Sales at 468,000 Annual Rate in January, Highest since 2008
by Calculated Risk on 2/26/2014 10:00:00 AM
The Census Bureau reports New Home Sales in January were at a seasonally adjusted annual rate (SAAR) of 468 thousand.
December sales were revised up from 414 thousand to 427 thousand, and November sales were revised down from 445 thousand to 444 thousand.
The first graph shows New Home Sales vs. recessions since 1963. The dashed line is the current sales rate.
Sales of new single-family houses in January 2014 were at a seasonally adjusted annual rate of 468,000, according to estimates released jointly today by the U.S. Census Bureau and the Department of Housing and Urban Development. This is 9.6 percent above the revised December rate of 427,000 and is 2.2 percent above the January 2013 estimate of 458,000.
 Click on graph for larger image in graph gallery.
This was the highest sales rate since 2008.
Even with the increase in sales over the last two years, new home sales are still near the bottom for previous recessions.
The second graph shows New Home Months of Supply.
The months of supply decreased in January to 4.7 months from 5.2 months in December.
The all time record was 12.1 months of supply in January 2009.
 This is now in the normal range (less than 6 months supply is normal).
"The seasonally adjusted estimate of new houses for sale at the end of January was 184,000. This represents a supply of 4.7 months at the current sales rate."On inventory, according to the Census Bureau:
"A house is considered for sale when a permit to build has been issued in permit-issuing places or work has begun on the footings or foundation in nonpermit areas and a sales contract has not been signed nor a deposit accepted."Starting in 1973 the Census Bureau broke this down into three categories: Not Started, Under Construction, and Completed.
 This graph shows the three categories of inventory starting in 1973.
The inventory of completed homes for sale is near the record low. The combined total of completed and under construction is still very low.
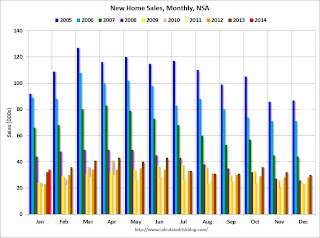
The last graph shows sales NSA (monthly sales, not seasonally adjusted annual rate).
In January 2014 (red column), 34 thousand new homes were sold (NSA). Last year 32 thousand homes were also sold in January. The high for January was 92 thousand in 2005, and the low for January was 213 thousand in 2011.

This was well above expectations of 405,000 sales in January.
I'll have more later today - but this was a decent start for 2014.
MBA: Mortgage Purchase Index lowest since 1995
by Calculated Risk on 2/26/2014 07:01:00 AM
From the MBA: Mortgage Applications Decrease in Latest MBA Weekly Survey
Mortgage applications decreased 8.5 percent from one week earlier, according to data from the Mortgage Bankers Association’s (MBA) Weekly Mortgage Applications Survey for the week ending February 21, 2014. ...
The Refinance Index decreased 11 percent from the previous week. The seasonally adjusted Purchase Index decreased 4 percent from one week earlier to the lowest level since 1995. ...
"Purchase applications were little changed on an unadjusted basis last week, but this is the time of a year we would expect a significant pickup in purchase activity, and we are not yet seeing it,” said Mike Fratantoni, MBA’s Chief Economist.
The average contract interest rate for 30-year fixed-rate mortgages with conforming loan balances ($417,000 or less) increased to 4.53 percent, the highest rate since week ending January 17, 2014, from 4.50 percent, with points increasing to 0.31 from 0.26 (including the origination fee) for 80 percent loan-to-value ratio (LTV) loans.
The average contract interest rate for 30-year fixed-rate mortgages with jumbo loan balances (greater than $417,000) increased to 4.47 percent, the highest rate since week ending January 24, 2014, from 4.45 percent, with points increasing to 0.13 from 0.11 (including the origination fee) for 80 percent LTV loans.
emphasis added
 Click on graph for larger image.
The first graph shows the refinance index.
The refinance index is down 72% from the levels in May 2013.
With the mortgage rate increases, refinance activity will be significantly lower in 2014 than in 2013.
 The second graph shows the MBA mortgage purchase index.
 The 4-week average of the purchase index is now down about 16% from a year ago - and the weekly purchase index is at the lowest level since 1995.
The purchase index is probably understating purchase activity because small lenders tend to focus on purchases, and those small lenders are underrepresented in the purchase index - but this is still very weak.
Note: Jumbo rates are still below conforming rates.
Tuesday, February 25, 2014
Wednesday: New Home Sales
by Calculated Risk on 2/25/2014 08:53:00 PM
An interesting article on land values from the WSJ: Land Investors Brace for Slowdown
A look at the sequential, quarter-to-quarter change in land prices underscores the cooling of the market. According to Zelman's monthly surveys of builders, brokers and developers in 55 major markets, prices of finished lots receded from their biggest recent gain—6.8% in the first quarter of 2013 from the previous quarter—to a more tepid 2.9% gain in last year's fourth quarter.Land prices fell sharply during the bust (land prices declined more than house prices), and prices increased quickly over the last couple of years. Now price appreciation is slowing.
Some economists and market observers now predict smaller price gains—and, in some cases, flat prices—for land in 2014. "We expect the pace of acceleration to ease," Zelman analyst Ryan McKeveny said.
Wednesday:
• At 7:00 AM ET, the The Mortgage Bankers Association (MBA) will release the results for the mortgage purchase applications index.
• At 10:00 AM, New Home Sales for January from the Census Bureau. The consensus is for a decrease in sales to 405 thousand Seasonally Adjusted Annual Rate (SAAR) in January from 414 thousand in December.


