by Calculated Risk on 3/13/2014 07:14:00 PM
Thursday, March 13, 2014
Friday: PPI, Consumer Sentiment
An important development from the WSJ: Senators Strike Deal on Long-Term Jobless Benefits
Congress has been stalled since extended federal jobless benefits expired on Dec. 28, 2013, taking away financial support from an estimated two million people so far.The key points:
...
Under the agreement reached Thursday, those who had lost benefits in late December would receive retroactive payments.
...
To ensure that the roughly $9.7 billion bill doesn't add to the federal budget deficit, it includes measures designed to generate new revenue.
The deal's fate in the Republican-controlled House of Representatives wasn't immediately clear. House Speaker John Boehner (R., Ohio) had said earlier this year that he would consider renewing the long-term benefits if lawmakers could come up with a plan to offset the cost ...
1) Not having extended benefits with so many suffering is unprecedented and bad policy.
2) The bill is retroactive.
3) The bill is paid for.
4) The bill is bipartisan.
5) But it still needs to pass the House.
Friday:
• At 8:30 AM ET, the Producer Price Index for February from the BLS. The consensus is for a 0.2% increase in prices.
• At 9:55 AM, the Reuter's/University of Michigan's Consumer sentiment index (preliminary for March). The consensus is for a reading of 81.8, up from 81.6 in February.
FNC: House prices increased 9.0% year-over-year in January
by Calculated Risk on 3/13/2014 03:04:00 PM
From FNC: FNC Index: Home Prices of Normal Sales Up 0.4% in January
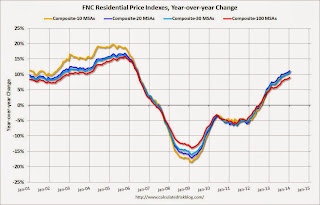
The latest FNC Residential Price Index™ (RPI) shows U.S. home prices have gotten off to a positive start in 2014, rising a modest 0.4% in January. The index, constructed to gauge the price movement among normal home sales exclusive of distressed properties, indicates home prices of the underlying housing market continue to strengthen as market fundamentals and credit conditions continue to improve.The 100-MSA composite was up 9.0% compared to January2013. The FNC index turned positive on a year-over-year basis in July, 2012.
The index is up 9.0% from a year ago and continues to point to the fastest year-over-year growth to date since the recovery began. Home prices are expected to rise modestly in February as improving signs are emerging in the for-sale market: The for-sale market has strengthened in February and the average seller asking price discount dropped from 5.4% in January to 4.7% in February.
...
Based on recorded sales of non-distressed properties (existing and new homes) in the 100 largest metropolitan areas, the FNC national composite index shows that in January home prices rose at a seasonally unadjusted rate of 0.4%. The two narrower indices (30- and 10- MSA composites) show faster month-over-month price appreciation in the nation’s top housing markets, up 0.6% and 0.8%, respectively. The 30- and 10-MSA composites’ year-over-year trends also show more rapid growth rate in the double digits and, similar to the national index, the fastest year-over-year growth to date since the recovery began.
emphasis added
 Click on graph for larger image.
This graph shows the year-over-year change for the FNC Composite 10, 20, 30 and 100 indexes.
Even with the recent increase, the FNC composite 100 index is still off 23.2% from the peak.
I'm expecting the year-over-year change in house prices to slow as more inventory comes on the market - but this index isn't showing a slowdown yet.
DataQuick: February Bay Area Home Sales Slowest Since 2008
by Calculated Risk on 3/13/2014 02:21:00 PM
From DataQuick: Bay Area Home Sales Slowest Since 2008
Bay Area home buyers were kept scrambling last month as a continued lack of inventory contributed heavily to a six-year low in sales. ...And on distressed sales:
A total of 4,963 new and resale houses and condos sold in the nine-county Bay Area last month. That was the lowest for any February since 2008, when 3,989 homes sold. Last month’s sales rose 5.7 percent from 4,696 in January, and fell 8.2 percent from 5,404 in February 2013, according to San Diego-based DataQuick.
Since 1988, when DataQuick’s statistics begin, February sales have ranged from a low of 3,989 in 2008 to a high of 8,901 in 2002. Last month’s sales were 19.9 percent below the average number of February sales – 6,194 – since 1988. Sales haven’t been above average for any month in more than seven years.
“A number of factors can keep a lid on sales. Affordability, for example. Or hard-to-get mortgages. These factors certainly play a role today, but clearly the main culprit is an inadequate supply of homes for sale. It’s going to be fascinating to watch how things play out between now and June. At some point rising home prices will trigger a more significant increase in the number of homes on the market. It’s just a question of when,” said John Walsh, DataQuick president.
Distressed property sales – the combination of foreclosure resales and “short sales” – made up about 12.5 percent of last month’s resale market. That was down from 14.0 percent in January and down from 34.1 percent a year earlier.This decline in sales is due to several factors: limited inventory, higher prices, and fewer distressed sales. With the recent price increases, more inventory should come on the market this year.
Foreclosure resales – homes that had been foreclosed on in the prior 12 months – accounted for 5.4 percent of resales in February, up from a revised 5.2 percent the month before, and down from 13.9 percent a year ago. Foreclosure resales peaked at 52.0 percent in February 2009. The monthly average for foreclosure resales over the past 17 years is 9.9 percent.
Short sales – transactions where the sale price fell short of what was owed on the property – made up an estimated 7.0 percent of Bay Area resales last month. That was down from an estimated 8.8 percent in January and down from 20.2 percent a year earlier.
Lawler: Preliminary Table of Distressed Sales and Cash buyers for Selected Cities in February
by Calculated Risk on 3/13/2014 10:58:00 AM
Economist Tom Lawler sent me the preliminary table below of short sales, foreclosures and cash buyers for several selected cities in February.
From CR: This is just a few markets for February - more to come.
Total "distressed" share is down in all of these markets, mostly because of a sharp decline in short sales.
Foreclosures are down in most of these areas too, although foreclosures are up a little in Las Vegas (there was a state law change that slowed foreclosures dramatically in Nevada at the end of 2011 - so it isn't a surprise that foreclosures are up a little year-over-year).
The All Cash Share (last two columns) is declining year-over-year. As investors pull back, the share of all cash buyers will probably decline.
In general it appears the housing market is slowly moving back to normal.
| Short Sales Share | Foreclosure Sales Share | Total "Distressed" Share | All Cash Share | |||||
|---|---|---|---|---|---|---|---|---|
| Feb-14 | Feb-13 | Feb-14 | Feb-13 | Feb-14 | Feb-13 | Feb-14 | Feb-13 | |
| Las Vegas | 14.0% | 37.9% | 12.0% | 10.2% | 26.0% | 48.1% | 46.8% | 59.5% |
| Reno** | 13.0% | 37.0% | 7.0% | 13.0% | 20.0% | 50.0% | ||
| Phoenix | 5.3% | 15.0% | 8.3% | 13.8% | 13.7% | 28.8% | 33.6% | 46.1% |
| Sacramento | 12.3% | 30.3% | 7.0% | 13.5% | 19.3% | 43.8% | 26.5% | 39.5% |
| Minneapolis | 5.0% | 11.3% | 25.3% | 32.7% | 30.3% | 43.9% | ||
| Mid-Atlantic | 7.7% | 13.6% | 10.9% | 12.1% | 18.6% | 25.6% | 21.4% | 22.8% |
| So. California* | 9.4% | 22.4% | 6.8% | 16.2% | 16.2% | 38.6% | 30.9% | 36.9% |
| Hampton Roads | 30.7% | 34.2% | ||||||
| Memphis* | 22.1% | 29.0% | ||||||
| Springfield IL** | 17.9% | 26.4% | ||||||
| *share of existing home sales, based on property records **Single Family Only ***GAMLS | ||||||||
Retail Sales increased 0.3% in February
by Calculated Risk on 3/13/2014 08:55:00 AM
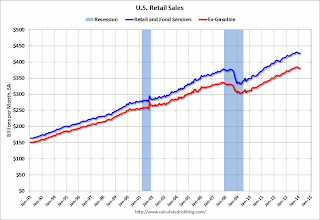
On a monthly basis, retail sales increased 0.3% from January to February (seasonally adjusted), and sales were up 1.5% from February 2013. Sales in December and January were revised down from a 0.4% decrease to a 0.6% decrease. From the Census Bureau report:
The U.S. Census Bureau announced today that advance estimates of U.S. retail and food services sales for February, adjusted for seasonal variation and holiday and trading-day differences, but not for price changes, were $427.2 billion, an increase of 0.3 percent from the previous month, and 1.5 percent above February 2013. ... The December 2013 to January 2014 percent change was revised from -0.4 percent to -0.6 percent.
 Click on graph for larger image.
This graph shows retail sales since 1992. This is monthly retail sales and food service, seasonally adjusted (total and ex-gasoline).
Retail sales ex-autos increased 0.3%.
The second graph shows the year-over-year change in retail sales and food service (ex-gasoline) since 1993.
 Retail sales ex-gasoline increased by 2.2% on a YoY basis (1.5% for all retail sales).
The increase in February was above consensus expectations, but the downward revisions to December and January were negatives.
However, it appears much of the weakness in January and February was due to the weather.


