by Calculated Risk on 3/18/2014 06:01:00 PM
Tuesday, March 18, 2014
LA area Port Traffic: Down year-over-year in February
Container traffic gives us an idea about the volume of goods being exported and imported - and possibly some hints about the trade report for January since LA area ports handle about 40% of the nation's container port traffic.
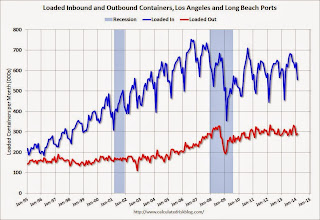
The following graphs are for inbound and outbound traffic at the ports of Los Angeles and Long Beach in TEUs (TEUs: 20-foot equivalent units or 20-foot-long cargo container).
To remove the strong seasonal component for inbound traffic, the first graph shows the rolling 12 month average.
 Click on graph for larger image.
On a rolling 12 month basis, inbound traffic was down 0.6% compared to the rolling 12 months ending in January. Outbound traffic was down 0.2% compared to 12 months ending in January.
Inbound traffic has generally been increasing, and outbound traffic has mostly been moving sideways.
The 2nd graph is the monthly data (with a strong seasonal pattern for imports).
 Usually imports peak in the July to October period as retailers import goods for the Christmas holiday, and then decline sharply and bottom in February or March (depending on the timing of the Chinese New Year).
Inbound traffic was down 7% compared to February 2013 and outbound traffic was down 2%.
This suggests a decrease in trade the trade deficit with Asia in February.
A comment on Housing Starts
by Calculated Risk on 3/18/2014 01:41:00 PM
There were 123.5 thousand total housing starts in January and February this year (not seasonally adjusted, NSA), down 1% from the 124.8 thousand during the first two months of 2013.
Historically January and February are the two weakest months of the year for housing starts (NSA) due to winter weather - and the weather this year was especially severe - so I wouldn't read too much into the weak start for 2014. Note: Permits were up 5% for the first two months of 2014 compared to 2013 - still weak growth, but positive.
I don't blame all of the recent weakness on the weather (probably just a small factor) - there are also higher mortgage rates, higher prices and probably supply constraints in some areas. But I still think fundamentals support a higher level of starts, and I expect starts to pick up solidly again this year.
Here is an update to the graph comparing multi-family starts and completions. Since it usually takes over a year on average to complete a multi-family project, there is a lag between multi-family starts and completions. Completions are important because that is new supply added to the market, and starts are important because that is future new supply (units under construction is also important for employment).
These graphs use a 12 month rolling total for NSA starts and completions.
 Click on graph for larger image.
The blue line is for multifamily starts and the red line is for multifamily completions.
The rolling 12 month total for starts (blue line) has been increasing steadily, and completions (red line) are lagging behind - but completions will continue to follow starts up (completions lag starts by about 12 months).
This means there will be an increase in multi-family completions in 2014, but probably still below the 1997 through 2007 level of multi-family completions. Multi-family starts will probably move more sideways in 2014.
 The second graph shows single family starts and completions. It usually only takes about 6 months between starting a single family home and completion - so the lines are much closer. The blue line is for single family starts and the red line is for single family completions.
Starts have been moving up, and completions have followed.
Note the exceptionally low level of single family starts and completions. The "wide bottom" was what I was forecasting several years ago, and now I expect several years of increasing single family starts and completions.
Key Measures Shows Low Inflation in February
by Calculated Risk on 3/18/2014 11:15:00 AM
The Cleveland Fed released the median CPI and the trimmed-mean CPI this morning:
According to the Federal Reserve Bank of Cleveland, the median Consumer Price Index rose 0.2% (2.2% annualized rate) in February. The 16% trimmed-mean Consumer Price Index also increased 0.2% (1.9% annualized rate) during the month. The median CPI and 16% trimmed-mean CPI are measures of core inflation calculated by the Federal Reserve Bank of Cleveland based on data released in the Bureau of Labor Statistics' (BLS) monthly CPI report.Note: The Cleveland Fed has the median CPI details for February here. The price for fuel oil and other fuels increased sharply in February.
Earlier today, the BLS reported that the seasonally adjusted CPI for all urban consumers rose 0.1% (1.2% annualized rate) in February. The CPI less food and energy increased 0.1% (1.4% annualized rate) on a seasonally adjusted basis.
 Click on graph for larger image.
This graph shows the year-over-year change for these four key measures of inflation. On a year-over-year basis, the median CPI rose 2.0%, the trimmed-mean CPI rose 1.6%, and the CPI less food and energy rose 1.6%. Core PCE is for January and increased just 1.1% year-over-year.
On a monthly basis, median CPI was at 2.2% annualized, trimmed-mean CPI was at 1.9% annualized, and core CPI increased 1.4% annualized.
These measures suggest inflation remains below the Fed's target.
Housing Starts at 907 Thousand Annual Rate in February
by Calculated Risk on 3/18/2014 08:30:00 AM
From the Census Bureau: Permits, Starts and Completions
Housing Starts:
Privately-owned housing starts in February were at a seasonally adjusted annual rate of 907,000. This is 0.2 percent below the revised January estimate of 909,000 and is 6.4 percent below the February 2013 rate of 969,000.
Single-family housing starts in February were at a rate of 583,000; this is 0.3 percent above the revised January figure of 581,000. The February rate for units in buildings with five units or more was 312,000.
emphasis added
Building Permits:
Privately-owned housing units authorized by building permits in February were at a seasonally adjusted annual rate of 1,018,000. This is 7.7 percent above the revised January rate of 945,000 and is 6.9 percent above the February 2013 estimate of 952,000.
Single-family authorizations in February were at a rate of 588,000; this is 1.8 percent below the revised January figure of 599,000. Authorizations of units in buildings with five units or more were at a rate of 407,000 in February.
 Click on graph for larger image.
The first graph shows single and multi-family housing starts for the last several years.
Multi-family starts (red, 2+ units) decreased slightly in February (Multi-family is volatile month-to-month).
Single-family starts (blue) increased slightly in February.
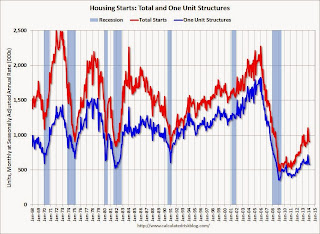
The second graph shows total and single unit starts since 1968.
 The second graph shows the huge collapse following the housing bubble, and that housing starts have been increasing after moving sideways for about two years and a half years.
 This was below expectations of 915 thousand starts in February. Note: Starts for January were revised up to 907 thousand from 880 thousand. I'll have more later.
Monday, March 17, 2014
Tuesday: Housing Starts, CPI
by Calculated Risk on 3/17/2014 08:39:00 PM
A reminder of a friendly bet I made with NDD on housing starts in 2014:
If starts or sales are up at least 20% YoY in any month in 2014, [NDD] will make a $100 donation to the charity of Bill's choice, which he has designated as the Memorial Fund in honor of his late co-blogger, Tanta. If housing permits or starts are down 100,000 YoY at least once in 2014, he make a $100 donation to the charity of my choice, which is the Alzheimer's Association.Of course, with the terms of the bet, we could both "win" at some point during the year. (I expect to "win" in a few months, but not now due to the severe weather and limited starts and sales in many parts of the country).
In February 2013, starts were at a 969 thousand seasonally adjusted annual rate (SAAR). For me to win, starts would have to be up 20% or at 1.162 million SAAR in February (not gonna happen). For NDD to win, starts would have to fall to 869 thousand SAAR (possible). NDD could also "win" if permits fall to 852 thousand SAAR from 952 thousand SAAR in February 2013.
Tuesday:
• At 8:30 AM ET, Consumer Price Index for February. The consensus is for a 0.1% increase in CPI in January and for core CPI to increase 0.1%.
• Also at 8:30 AM, Housing Starts for February. Total housing starts were at 880 thousand (SAAR) in January. Single family starts were at 573 thousand SAAR in January. The consensus is for total housing starts to increase to 915 thousand (SAAR) in February.


