by Calculated Risk on 11/03/2014 09:00:00 PM
Monday, November 03, 2014
Tuesday: Trade Deficit
Two weeks ago, Professor James Hamilton wrote: How will Saudi Arabia respond to lower oil prices? (read entire piece!). Hamilton wrote:
it’s primarily a question of responding to surging output of U.S. tight oil. My guess is that Saudi Arabia would lower prices rather than cut production ...And today from the WSJ: Oil Skids as Saudis Adjust Prices
U.S. oil prices tumbled to a fresh two-year low Monday on news that Saudi Arabia cut its selling price for oil to the U.S., suggesting that the kingdom is trying to compete with U.S. shale oil.Bloomberg shows WTI down to $78.24 a barrel, and Brent down to $84.78. So gasoline prices should continue to decline (currently $2.96 per gallon national average).
Tuesday:
• At 8:30 AM ET, the Trade Balance report for September from the Census Bureau. The consensus is for the U.S. trade deficit to be at $40.7 billion in September from $40.1 billion in August.
• At 10:00 AM, the Manufacturers' Shipments, Inventories and Orders (Factory Orders) for September. The consensus is for a 0.7 decrease in September orders.
Fed Survey: Banks "eased standards for construction and land development loans"
by Calculated Risk on 11/03/2014 05:12:00 PM
From the Federal Reserve: The October 2014 Senior Loan Officer Opinion Survey on Bank Lending Practices
Regarding loans to businesses, the October survey results indicated that only a modest net fraction of banks eased their standards for commercial and industrial (C&I) loans to firms of all sizes, but generally larger net fractions of banks eased each of the pricing terms listed in the survey and some non-price terms. Banks also reported having eased standards for construction and land development loans, a category of commercial real estate (CRE) loans included in the survey. On the demand side, modest net fractions of banks reported stronger demand for C&I loans to larger firms; similar net fractions experienced stronger demand for all three categories of CRE loans covered in the survey.
...
Regarding loans to households, some large banks reported having eased standards on closed-end mortgage loans, but respondents generally indicated little change in standards and terms for other types of loans to households. Reported changes in loan demand were mixed. Moderate net fractions of banks reported stronger demand for auto loans and weaker demand for nontraditional closed-end mortgage loans. Demand for other types of loans to households was about unchanged at most banks.
emphasis added
 Click on graph for larger image.
Here are some charts from the Fed.
This graph shows the change in lending standards and for CRE (commercial real estate) loans.
Banks are loosening their standards for CRE loans, and for various categories of CRE (right half of graph). Multifamily is seeing slightly tighter standards for the second consecutive quarter.
The second graph shows the change in demand for CRE loans.
 Banks are seeing a pickup in demand for all categories of CRE.
This suggests (along with the Architecture Billing Index) that we will see a further increase in commercial real estate development.
U.S. Light Vehicle Sales unchanged at 16.35 million annual rate in October
by Calculated Risk on 11/03/2014 02:30:00 PM
Based on an WardsAuto estimate, light vehicle sales were at a 16.35 million SAAR in October. That is up 7% from October 2013, and unchanged from the 16.34 million annual sales rate last month.

This graph shows the historical light vehicle sales from the BEA (blue) and an estimate for October (red, light vehicle sales of 16.35 million SAAR from WardsAuto).
This was below the consensus forecast of 16.6 million SAAR (seasonally adjusted annual rate).

Note: dashed line is current estimated sales rate.
This was the sixth consecutive month with a sales rate over 16 million.
Construction Spending decreased 0.4% in September
by Calculated Risk on 11/03/2014 11:29:00 AM
Earlier the Census Bureau reported that overall construction spending decreased in September:
The U.S. Census Bureau of the Department of Commerce announced today that construction spending during September 2014 was estimated at a seasonally adjusted annual rate of $950.9 billion, 0.4 percent below the revised August estimate of $955.2 billion.. The September figure is 2.9 percent (±2.1%) above the September 2013 estimate of $924.2 billion.Both private and public spending decreased in September:
Spending on private construction was at a seasonally adjusted annual rate of $680.0 billion, 0.1 percent below the revised August estimate of $680.8 billion. Residential construction was at a seasonally adjusted annual rate of $349.1 billion in September, 0.4 percent above the revised August estimate of $347.7 billion. Nonresidential construction was at a seasonally adjusted annual rate of $331.0 billion in September, 0.6 percent below the revised August estimate of $333.0 billion. ...Note: Non-residential for offices and hotels is increasing, but spending for oil and gas is declining. Early in the recovery, there was a surge in non-residential spending for oil and gas (because prices increased), but now, with falling prices, oil and gas is a drag on overall construction spending.
In September, the estimated seasonally adjusted annual rate of public construction spending was $270.9 billion, 1.3 percent below the revised August estimate of $274.4 billion.
emphasis added
As an example, construction spending for lodging is up 15% year-over-year, whereas spending for power (includes oil and gas) construction is down 11% since peaking in May.
 Click on graph for larger image.
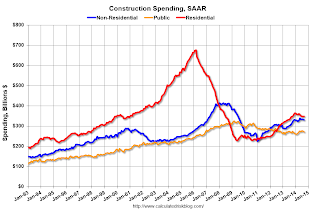
This graph shows private residential and nonresidential construction spending, and public spending, since 1993. Note: nominal dollars, not inflation adjusted.
Private residential spending has declined recently and is 48% below the peak in early 2006 - but up 53% from the post-bubble low.
Non-residential spending is 20% below the peak in January 2008, and up about 47% from the recent low.
Public construction spending is now 17% below the peak in March 2009 and about 4% above the post-recession low.
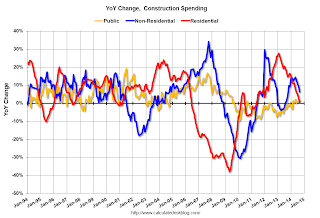
 The second graph shows the year-over-year change in construction spending.
On a year-over-year basis, private residential construction spending is now up 1%. Non-residential spending is up 6% year-over-year. Public spending is up 2% year-over-year.
Looking forward, all categories of construction spending should increase in 2015. Residential spending is still very low, non-residential is starting to pickup, and public spending has probably hit bottom after several years of austerity.
This was a weak report - well below the consensus forecast of a 0.6% increase - and there were also downward revisions to spending in July and August.
ISM Manufacturing index increases to 59.0 in October
by Calculated Risk on 11/03/2014 10:04:00 AM
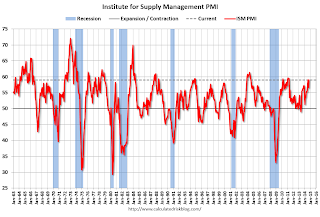
The ISM manufacturing index suggests faster expansion in October than in September. The PMI was at 59.0% in October, up from 56.6% in September. The employment index was at 55.5%, up from 54.6% in September, and the new orders index was at 65.8%, up from 60.0%.
From the Institute for Supply Management: October 2014 Manufacturing ISM® Report On Business®
Economic activity in the manufacturing sector expanded in October for the 17th consecutive month, and the overall economy grew for the 65th consecutive month, say the nation’s supply executives in the latest Manufacturing ISM® Report On Business®.
The report was issued today by Bradley J. Holcomb, CPSM, CPSD, chair of the Institute for Supply Management® (ISM®) Manufacturing Business Survey Committee. "The October PMI® registered 59 percent, an increase of 2.4 percentage points from September’s reading of 56.6 percent, indicating continued expansion in manufacturing. The New Orders Index registered 65.8 percent, an increase of 5.8 percentage points from the 60 percent reading in September, indicating growth in new orders for the 17th consecutive month. The Production Index registered 64.8 percent, 0.2 percentage point above the September reading of 64.6 percent. The Employment Index grew for the 16th consecutive month, registering 55.5 percent, an increase of 0.9 percentage point above the September reading of 54.6 percent. Inventories of raw materials registered 52.5 percent, an increase of 1 percentage point from the September reading of 51.5 percent, indicating growth in inventories for the third consecutive month. Comments from the panel generally cite positive business conditions, with growth in demand and production volumes."
emphasis added
 Click on graph for larger image.
Here is a long term graph of the ISM manufacturing index.
This was above expectations of 56.0%, and indicates solid expansion in October.


