by Calculated Risk on 4/03/2015 01:31:00 PM
Friday, April 03, 2015
Reis: Mall Vacancy Rate declined in Q1
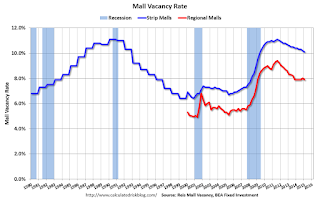
Reis reported that the vacancy rate for regional malls was decreased to 7.9% in Q1 2015 from 8.0% in Q4. This is down from a cycle peak of 9.4% in Q3 2011.
For Neighborhood and Community malls (strip malls), the vacancy rate decreased to 10.1% in Q1, from 10.2% in Q4. For strip malls, the vacancy rate peaked at 11.1% in Q3 2011.
Comments from Reis Senior Economist and Director of Research Ryan Severino:
[Strip Malls] Following the trend of recent quarters, neighborhood and community center vacancy declined by just 10 basis points during the quarter to 10.1%. Although neither net absorption nor construction were particularly robust, demand exceeded supply by a wide enough margin to cause vacancy rates to continue falling. Although rent growth remains weak, that fact that it even continues to grow in the face of such an elevated vacancy rate is a mildly heartening sign for the sector.
[Regional] The vacancy rate for malls also declined by 10 basis points while asking rents grew by 0.5%, the sixteenth consecutive quarter of growth. Taken together, the data for both neighborhood and community centers and malls indicates that the recovery, while not yet accelerating, is becoming more consistent. Quarterly rent growth is now the norm and continues to drift higher while vacancy compression, though slowing for regional malls, is also beginning to occur on a quarterly basis.
...
The quarterly improvement in market fundamentals should persist as we move forward in 2015. ... Construction remained at low levels during the first quarter and is not set to change anytime soon. The combination of little supply growth and increasing demand bodes well for most retail formats in the US.
 Click on graph for larger image.
This graph shows the strip mall vacancy rate starting in 1980 (prior to 2000 the data is annual). The regional mall data starts in 2000. Back in the '80s, there was overbuilding in the mall sector even as the vacancy rate was rising. This was due to the very loose commercial lending that led to the S&L crisis.
In the mid-'00s, mall investment picked up as mall builders followed the "roof tops" of the residential boom (more loose lending). This led to the vacancy rate moving higher even before the recession started. Then there was a sharp increase in the vacancy rate during the recession and financial crisis.
Mall vacancy data courtesy of Reis.
Employment Report Comments and Graphs
by Calculated Risk on 4/03/2015 10:45:00 AM
Earlier: March Employment Report: 126,000 Jobs, 5.5% Unemployment Rate
This was a disappointing employment report with 126,000 jobs added, and downward revisions to the January and February reports (combined were 69,000 less than previously reported).
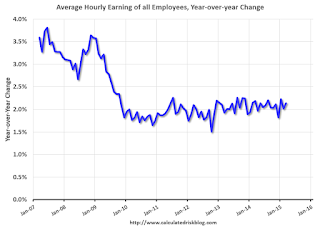
However, maybe there was a hint of good news on wage growth, from the BLS: "In March, average hourly earnings for all employees on private nonfarm payrolls rose by 7 cents to $24.86. Over the year, average hourly earnings have risen by 2.1 percent." However weekly hours declined in March.
A few more numbers: Total employment increased 126,000 from February to March and is now 2.8 million above the previous peak. Total employment is up 11.5 million from the employment recession low.
Private payroll employment increased 129,000 from February to March, and private employment is now 3.3 million above the previous peak. Private employment is up 12.1 million from the recession low.
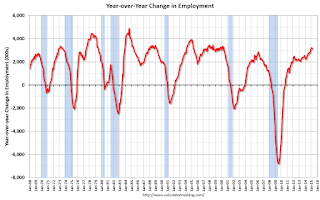
In March, the year-over-year change was 3.1 million jobs. This was the fourth month in a row with the year-over-year gain above 3.1 million.
Employment-Population Ratio, 25 to 54 years old

In the earlier period the participation rate for this group was trending up as women joined the labor force. Since the early '90s, the participation rate moved more sideways, with a downward drift starting around '00 - and with ups and downs related to the business cycle.
The 25 to 54 participation rate decreased in February to 80.9%, and the 25 to 54 employment population ratio decreased to 77.2%. As the recovery continues, I expect the participation rate for this group to increase a little more (or at least stabilize for a couple of years) - although the participation rate has been trending down for this group since the late '90s.
Average Hourly Earnings

The blue line shows the nominal year-over-year change in "Average Hourly Earnings" for all private employees. Nominal wage growth increased slightly to 2.1%, and wages were revised up from January and February. Wages will probably pick up a little this year.
Note: CPI has been running under 2%, so there has been some real wage growth.
Part Time for Economic Reasons

The number of persons employed part time for economic reasons (sometimes referred to as involuntary part-time workers) was little changed in March at 6.7 million. These individuals, who would have preferred full-time employment, were working part time because their hours had been cut back or because they were unable to find a full-time job.The number of persons working part time for economic reasons increased in March to 6.705 million from 6.635 million in February. This suggests slack still in the labor market. These workers are included in the alternate measure of labor underutilization (U-6) that decreased to 10.9% in February from 11.0% in February. This is the lowest level for U-6 since August 2008.
Unemployed over 26 Weeks
 This graph shows the number of workers unemployed for 27 weeks or more.
 According to the BLS, there are 2.563 million workers who have been unemployed for more than 26 weeks and still want a job. This was down from 2.709 million in January. This is trending down, but is still very high.
State and Local Government
 This graph shows total state and government payroll employment since January 2007. State and local governments had lost jobs for four straight years. (Note: Scale doesn't start at zero to better show the change.)
 In March 2015, state and local governments lost 1,000 jobs. State and local government employment is now up 128,000 from the bottom, but still 630,000 below the peak.
State and local employment is now generally increasing. And Federal government layoffs have slowed (Federal payrolls lost 2,000 jobs in March).
This was a disappointing report for March, but the year-over-year employment gains are still solid.
March Employment Report: 126,000 Jobs, 5.5% Unemployment Rate
by Calculated Risk on 4/03/2015 08:43:00 AM
From the BLS:
Total nonfarm payroll employment increased by 126,000 in March, and the unemployment rate was unchanged at 5.5 percent, the U.S. Bureau of Labor Statistics reported today. Employment continued to trend up in professional and business services, health care, and retail trade, while mining lost jobs.
...
The change in total nonfarm payroll employment for January was revised from +239,000 to +201,000, and the change for February was revised from +295,000 to +264,000. With these revisions, employment gains in January and February combined were 69,000 less than previously reported.
emphasis added
 Click on graph for larger image.
The first graph shows the monthly change in payroll jobs, ex-Census (meaning the impact of the decennial Census temporary hires and layoffs is removed - mostly in 2010 - to show the underlying payroll changes).
Total payrolls increased by 126 thousand in March (private payrolls increased 129 thousand).
Payrolls for January and February were revised down by a combined 69 thousand.
 This graph shows the year-over-year change in total non-farm employment since 1968.
In March, the year-over-year change was 3.1 million jobs.
Even with the weakness in March, this is a solid year-over-year gain.
 The third graph shows the employment population ratio and the participation rate.
The Labor Force Participation Rate decreased in March to 62.7%. This is the percentage of the working age population in the labor force. A large portion of the recent decline in the participation rate is due to demographics.
The Employment-Population ratio was unchanged at 59.3% (black line).
I'll post the 25 to 54 age group employment-population ratio graph later.
 The fourth graph shows the unemployment rate.
 The unemployment rate was unchanged at March to 5.5%.
This was well below expectations of 247,000, and there were downward revisions to January and February ... a disappointing report.
I'll have much more later ...
Thursday, April 02, 2015
Friday: Jobs, Jobs, Jobs
by Calculated Risk on 4/02/2015 07:01:00 PM
Here was an employment preview I posted earlier: Preview for March Employment Report
Friday:
• At 8:30 AM ET, the Employment Report for March. The consensus is for an increase of 247,000 non-farm payroll jobs added in March, down from the 295,000 non-farm payroll jobs added in February. The consensus is for the unemployment rate to be unchanged at 5.5%.
• Early: Reis Q1 2015 Mall Survey of rents and vacancy rates.
Preview for March Employment Report
by Calculated Risk on 4/02/2015 02:49:00 PM
Friday at 8:30 AM ET, the BLS will release the employment report for March. The consensus, according to Bloomberg, is for an increase of 247,000 non-farm payroll jobs in March (with a range of estimates between 200,000 and 271,000), and for the unemployment rate to be unchanged at 5.5%.
The BLS reported 295,000 jobs added in February.
First, from Goldman Sachs economist David Mericle: "We expect nonfarm payroll job growth of 220k in March, below the consensus forecast of 245k. Labor market indicators were generally flat or weaker in March, suggesting payroll growth somewhat below the recent trend. We expect the unemployment rate to remain unchanged at 5.5% and average hourly earnings to rise 0.2%, roughly in line with the recent trend rate of wage growth."
Here is a summary of recent data:
• The ADP employment report showed an increase of 189,000 private sector payroll jobs in March. This was below expectations of 225,000 private sector payroll jobs added. The ADP report hasn't been very useful in predicting the BLS report for any one month, but in general, this suggests employment growth below expectations.
• The ISM manufacturing employment index decreased in March to 50.0%. A historical correlation between the ISM manufacturing employment index and the BLS employment report for manufacturing, suggests that private sector BLS manufacturing payroll jobs declined by 20,000 in March. The ADP report indicated a 1,000 decrease for manufacturing jobs in March.
The ISM non-manufacturing employment index will not be released until Monday.
• Initial weekly unemployment claims averaged close to 285,000 in March, down from 305,000 in February. For the BLS reference week (includes the 12th of the month), initial claims were at 293,000; this was up from 285,000 during the reference week last month.
Generally this suggests fewer layoffs, seasonally adjusted, in March compared to February.
• The final March University of Michigan consumer sentiment index decreased to 93.0 from the February reading of 95.4. Sentiment is frequently coincident with changes in the labor market, but this decrease is probably mostly due to an increase in gasoline prices in early March.
• Trim Tabs reported that the U.S. economy added 268,000 in March. This was up from their 215,000 and 245,000 range last month. "TrimTabs’ employment estimates are based on analysis of daily income tax deposits to the U.S. Treasury from the paychecks of the 141 million U.S. workers subject to withholding".
• On small business hiring: The small business index from Intuit showed a 15,000 increase in small business employment in March, up from 10,000 added in February.
Also on small business, NFIB reported: “Reported hiring in March was one of the best readings in the last decade eclipsing the substantial readings in January and February, but this might have reflected the heavy hiring over the past three months.”
• Conclusion: There is always some randomness to the employment report, and the indicators were mixed in March. Manufacturing employment was probably down (especially in petroleum industries, and also due to the West Coast port slowdown). However small business employment was probably up.

In February, the year-over-year change was 3.3 million jobs. Last March, the economy added 225,000 jobs according to the BLS, so anything above 225,000 (including revisions) will increase the year-over-year change (already highest since the '90s).


