by Calculated Risk on 4/06/2015 08:31:00 PM
Monday, April 06, 2015
Tuesday: Job Openings
A depressing quote from Paul Krugman: Economics and Elections
[A] large body of political science research [on elections shows] ... What mainly matters is income growth immediately before the election. And I mean immediately: We’re talking about something less than a year, maybe less than half a year.This is why we see political stunts in odd years (threats to not pay the bills, government shutdowns). People forget quickly.
This is, if you think about it, a distressing result, because it says that there is little or no political reward for good policy. A nation’s leaders may do an excellent job of economic stewardship for four or five years yet get booted out because of weakness in the last two quarters before the election.
Monday:
• At 10:00 AM, Job Openings and Labor Turnover Survey for February from the BLS. Job openings increased in January to 4.998 million from 4.877 million in December. The number of job openings were up 28% year-over-year, and Quits were up 17% year-over-year.
• At 3:00 PM, Consumer Credit for March from the Federal Reserve. The consensus is for a $14 billion increase in credit.
Update: U.S. Heavy Truck Sales
by Calculated Risk on 4/06/2015 04:08:00 PM
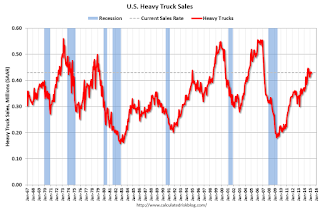
Click on graph for larger image.
This graph shows heavy truck sales since 1967 using data from the BEA. The dashed line is the March 2015 seasonally adjusted annual sales rate (SAAR).
Heavy truck sales really collapsed during the recession, falling to a low of 181 thousand in April 2009 on a seasonally adjusted annual rate basis (SAAR). Since then sales have more than doubled and hit 446 thousand SAAR in August 2014. Sales have declined a little since August (possibly due to the oil sector), and were at 430 thousand SAAR in March.
The level in August 2014 was the highest level since February 2007 (over 7 years ago). Sales have been above 400 thousand SAAR for nine consecutive months, are now above the average (and median) of the last 20 years.
Zillow: February Case-Shiller House Price Index year-over-year change expected to be about the same as in January
by Calculated Risk on 4/06/2015 12:40:00 PM
The Case-Shiller house price indexes for January were released last week. Zillow forecasts Case-Shiller a month early - now including the National Index - and I like to check the Zillow forecasts since they have been pretty close.
From Zillow: Expect More of the Same From Case-Shiller in Feb.
The January S&P/Case-Shiller (SPCS) data published yesterday showed healthy home price appreciation largely in line with prior months, with 4.5 percent annual growth in the U.S. National Index in January, down slightly from 4.6 percent annual growth in December.So the year-over-year change in for February Case-Shiller index will probably be about the same as in the January report.
Annual appreciation in home values as measured by SPCS has been less than 5 percent for the past five months. We anticipate this trend to continue, with next month’s (February) national index expected to rise 4.4 percent, in line with historically normal levels between 3 percent and 5 percent.
The 10- and 20-City Composite Indices both experienced modest bumps in annual growth rates in January; the 10-City index rose 4.4 percent and the 20-City Index rose to 4.6 percent–up from rates of 4.3 percent and 4.5 percent, respectively, in December. The non-seasonally adjusted (NSA) 10- and 20-City indices were flat from December to January, and we expect both to remain flat in February (NSA).
All forecasts are shown in the table below. These forecasts are based on the January SPCS data release and the February 2014 Zillow Home Value Index (ZHVI), released March 27. Officially, the SPCS Composite Home Price Indices for January will not be released until Tuesday, April 28.
| Zillow Case-Shiller Forecast | ||||||
|---|---|---|---|---|---|---|
| Case-Shiller Composite 10 | Case-Shiller Composite 20 | Case-Shiller National | ||||
| NSA | SA | NSA | SA | NSA | SA | |
| January Actual YoY | 4.4% | 4.4% | 4.6% | 4.6% | 4.5% | 4.5% |
| February Forecast YoY | 4.4% | 4.4% | 4.6% | 4.6% | 4.4% | 4.4% |
| February Forecast MoM | 0.0% | 0.6% | 0.0% | 0.6% | 0.3% | 0.5% |
From Zillow:
The Zillow Home Value Index rose 4.9 percent year-over-year in February, the first month of sub-5 percent annual appreciation since May 2013. Zillow data shows the annual home value appreciation rate has fallen every month since April, and we expect this slowdown to continue throughout 2015. The January Zillow Home Value Forecast calls for a 2.6 percent rise in home values through February 2016. Further details on our forecast of home values can be found here, and more on Zillow’s full January 2014 report can be found here.
ISM Non-Manufacturing Index decreased to 56.5% in March
by Calculated Risk on 4/06/2015 10:05:00 AM
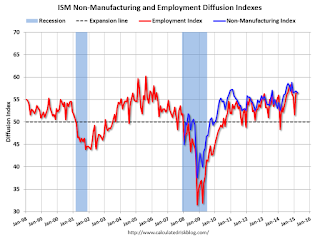
The March ISM Non-manufacturing index was at 56.5%, down from 56.9% in February. The employment index increased in March to 56.6%, up slightly from 56.4% in February. Note: Above 50 indicates expansion, below 50 contraction.
From the Institute for Supply Management: March 2015 Non-Manufacturing ISM Report On Business®
Economic activity in the non-manufacturing sector grew in March for the 62nd consecutive month, say the nation’s purchasing and supply executives in the latest Non-Manufacturing ISM® Report On Business®.
The report was issued today by Anthony Nieves, CPSM, C.P.M., CFPM, chair of the Institute for Supply Management® (ISM®) Non-Manufacturing Business Survey Committee. "The NMI® registered 56.5 percent in March, 0.4 percentage point lower than the February reading of 56.9 percent. This represents continued growth in the non-manufacturing sector. The Non-Manufacturing Business Activity Index decreased to 57.5 percent, which is 1.9 percentage points lower than the February reading of 59.4 percent, reflecting growth for the 68th consecutive month at a slower rate. The New Orders Index registered 57.8 percent, 1.1 percentage points higher than the reading of 56.7 percent registered in February. The Employment Index increased 0.2 percentage point to 56.6 percent from the February reading of 56.4 percent and indicates growth for the 13th consecutive month. The Prices Index increased 2.7 percentage points from the February reading of 49.7 percent to 52.4 percent, indicating prices increased in March after three consecutive months of decreasing. According to the NMI®, 14 non-manufacturing industries reported growth in March. The majority of respondents’ comments reflect stability and are mostly positive about business conditions and the overall economy."
emphasis added
 Click on graph for larger image.
This graph shows the ISM non-manufacturing index (started in January 2008) and the ISM non-manufacturing employment diffusion index.
This was close to the consensus forecast of 56.7% and suggests slightly slower expansion in March than in February. Overall this was a solid report.
Black Knight February Mortgage Monitor: Foreclosure Rate still "175 percent above pre-crisis norms"
by Calculated Risk on 4/06/2015 07:07:00 AM
Black Knight Financial Services (BKFS) released their Mortgage Monitor report for February today. According to BKFS, 5.36% of mortgages were delinquent in February, down from 5.56% in January. BKFS reported that 1.58% of mortgages were in the foreclosure process, down from 2.22% in February 2014.
This gives a total of 6.94% delinquent or in foreclosure. It breaks down as:
• 1,646,000 properties that are 30 or more days, and less than 90 days past due, but not in foreclosure.
• 1,067,000 properties that are 90 or more days delinquent, but not in foreclosure.
• 800,000 loans in foreclosure process.
For a total of 3,512,000 loans delinquent or in foreclosure in February. This is down from 4,106,000 in February 2014.

From Black Knight:
Delinquency and foreclosure inventories continue to trend towards pre-crisis normsAlso from Black Knight:
February’s delinquency rate, while still 17 percent above the pre-crisis norm of 4.6 percent, was down 49 percent from its January 2010 peak of 10.6 percent
At 1.58 percent, the foreclosure rate remained 175 percent above precrisis norms, but was still down 63 percent from its October 2011 peak
Today, the Data and Analytics division of Black Knight Financial Services released its latest Mortgage Monitor Report, based on data as of the end of February 2015. Black Knight revisited its periodic review of potential refinance candidates, looking at broad-based eligibility criteria, and found that in light of recent mortgage interest rate decreases, the population of potential refinance candidates currently sits at 7.1 million. However, according to Trey Barnes, Black Knight’s senior vice president of Loan Data Products, this number has the potential to decline should rates climb, even marginally.There is much more in the mortgage monitor.
“Black Knight looked at the population of borrowers whose current interest rates – as well as credit scores and loan-to-value ratios – mark them as good candidates for refinancing,” said Barnes. “In February 2014, there were approximately 4.1 million borrowers who could both benefit from and potentially qualify for refinancing their mortgages. Through a combination of declining interest rates and increased equity among borrowers driven by home price increases, an additional three million borrowers now meet the same broad-based eligibility criteria as compared to one year prior. As of the end of February 2015, there were a total of 7.1 million potential refinance candidates.


