by Calculated Risk on 4/10/2015 10:30:00 AM
Friday, April 10, 2015
BofA: "Farewell winter blues"
We recently saw another spate of recession calls (my response was R-E-L-A-X). There are several reasons for the recent economic weakness including seasonal factors, poor weather, the West Cost port slowdown, the stronger dollar and lower oil prices (the negative impacts are more obvious, but overall lower prices will be a positive). It looks like consumer spending in March was solid.
Excerpts from a research note from BofA: "Farewell winter blues"
There is finally good news to report on the US consumer. Spending on BAC credit and debit cards was up sharply in March, following a string of weak reports. Our measure of core retail sales - ex-autos and gasoline sales - increased 0.9% mom on a seasonally adjusted basis in March. This is a notable improvement from the past three months of essentially no growth. If we include gasoline station sales, the swing is even more dramatic given the significant adjustment in gasoline prices. ...
As always when analyzing economic data, we have to be careful not to overreact to just one report. The gain in March follows several months of weak data, making the comparisons more favorable. Moreover, the early Easter holiday might have sent people shopping in late March. The weather is also an important factor; ... the regions with the harshest winter weather showed the largest declines in February and strongest gains in March.
We are hopeful that the gain in March is the beginning of a healthier trajectory for consumer spending. As we have been arguing, all signs point to a solid consumer backdrop. ... Households have repaired their balance sheets and animal spirits have improved with consumer confidence trending higher. We are therefore holding to our core view that consumer spending will accelerate into 2Q, providing much-need support to GDP tracking.
Thursday, April 09, 2015
Hotels near Record Occupancy Pace
by Calculated Risk on 4/09/2015 08:09:00 PM
From HotelNewsNow.com: STR: US hotel results for week ending 4 April
he U.S. hotel industry recorded mixed results in the three key performance measurements during the week of 29 March through 4 April 2015, according to data from STR, Inc.Note: ADR: Average Daily Rate, RevPAR: Revenue per Available Room.
In year-over-year measurements, the industry’s occupancy decreased 4.0 percent to 62.9 percent. Average daily rate increased 3.4 percent to finish the week at US$116.01. Revenue per available room for the week was down 0.7 percent to finish at US$72.93.
“The industrywide decline in RevPAR was driven by softness related to Passover and Easter,” said Brad Garner, STR’s senior VP for client relationships. “This was the first time in 49 weeks that U.S. RevPAR was negative for a week—the longest stretch of positive weekly RevPAR growth STR has ever tracked. The last time RevPAR went negative for a week (-0.3 percent) was the week heading into Passover and Easter in 2014. We would anticipate a quick RevPAR return to normalcy and another positive streak into the foreseeable future. STR is projecting an annual RevPAR increase of 6.4 percent in 2015.”
emphasis added
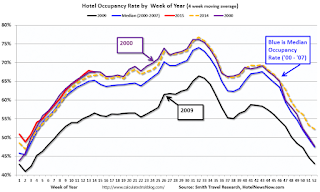
The following graph shows the seasonal pattern for the hotel occupancy rate using the four week average.
Hotels are now in the Spring travel period and business travel will be solid over the next couple of months (the decline was related to the timing of Easter and Passover).
 Click on graph for larger image.
The red line is for 2015, dashed orange is 2014, blue is the median, and black is for 2009 - the worst year since the Great Depression for hotels. Purple is for 2000.
The 4-week average of the occupancy rate is solidly above the median for 2000-2007, and solidly above 2014.
So far 2015 is close to 2000 (best year for hotels) - and 2015 will probably be the best year on record for hotels.
Data Source: Smith Travel Research, Courtesy of HotelNewsNow.com
Freddie Mac: 30 Year Mortgage Rates decrease to 3.66% in Latest Weekly Survey
by Calculated Risk on 4/09/2015 03:01:00 PM
From Freddie Mac today: Mortgage Rates Lower on Weak Jobs Report
Freddie Mac today released the results of its Primary Mortgage Market Survey® (PMMS®), showing average fixed mortgage rates moving lower following a weaker than expected jobs report for March. ...
30-year fixed-rate mortgage (FRM) averaged 3.66 percent with an average 0.6 point for the week ending April 9, 2015, down from last week when it averaged 3.70 percent. A year ago at this time, the 30-year FRM averaged 4.34 percent.
15-year FRM this week averaged 2.93 percent with an average 0.6 point, down from last week when it averaged 2.98 percent. A year ago at this time, the 15-year FRM averaged 3.38 percent.
 Click on graph for larger image.
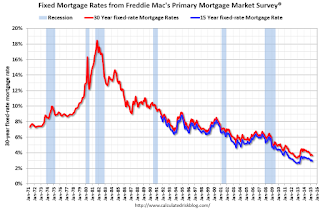
This graph shows the 30 year and 15 year fixed rate mortgage interest rates from the Freddie Mac Primary Mortgage Market Survey®.
30 year mortgage rates are up a little (31 bps) from the all time low of 3.35% in late 2012, but down from 4.34% a year ago.
The Freddie Mac survey started in 1971. Mortgage rates were below 5% back in the 1950s.
Lawler: Good Start to Spring home-selling Season
by Calculated Risk on 4/09/2015 12:10:00 PM
From the WSJ: Housing Market Sees Hopeful Signs of Spring
The downturn was brutal for Jacksonville; home sales sank and foreclosures were running at high levels during the crisis. But in recent months, home sales have shot up, the percentage of distressed homes on the market has declined and traffic at model homes in new subdivisions has been brisk.Other cities with solid year-over-year performance are Phoenix and Las Vegas.
Local home builders and real-estate agents report the most vibrant period of home sales since 2006. Finalized sales of existing homes in the Jacksonville area were up 18% in March from a year earlier, and pending sales were up 30% in that span, according to the Northeast Florida Association of Realtors.
...
“The spring home-selling season is off to a very good start,” said Thomas Lawler, a housing economist in Leesburg, Va. “I think the rest of the season is going to be materially better than a year ago.”
Weekly Initial Unemployment Claims increased to 281,000, 4-Week Average Lowest Since 2000
by Calculated Risk on 4/09/2015 08:36:00 AM
The DOL reported:
In the week ending April 4, the advance figure for seasonally adjusted initial claims was 281,000, an increase of 14,000 from the previous week's revised level. The previous week's level was revised down by 1,000 from 268,000 to 267,000. The 4-week moving average was 282,250, a decrease of 3,000 from the previous week's revised average. This is the lowest level for this average since June 3, 2000 when it was 281,500. The previous week's average was revised down by 250 from 285,500 to 285,250.The previous week was revised down to 267,000.
There were no special factors impacting this week's initial claims.
The following graph shows the 4-week moving average of weekly claims since January 2000.
 Click on graph for larger image.
The dashed line on the graph is the current 4-week average. The four-week average of weekly unemployment claims decreased to 282,250.
This was below the consensus forecast of 285,000, and the low level of the 4-week average suggests few layoffs.


