by Calculated Risk on 4/12/2015 10:44:00 AM
Sunday, April 12, 2015
An update on oil prices
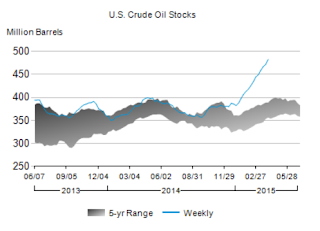
Demand for gasoline has picked up significantly recently. In January, U.S. vehicle miles driven hit a new all time high. However inventories are still at record levels (see first graph) and there is the possibility of significantly more global supply from Iran (see EIA discussion below).
Also note that oil imports have increase recently (the U.S. is a large oil importer).
Here is an excerpt from the Weekly Petroleum Status Report
U.S. crude oil refinery inputs averaged over 15.9 million barrels per day during the week ending April 3, 2015, 201,000 barrels per day more than the previous week’s average. Refineries operated at 90.1% of their operable capacity last week. ...
U.S. crude oil imports averaged over 8.2 million barrels per day last week, up by 869,000 barrels per day from the previous week. Over the last four weeks, crude oil imports averaged over 7.6 million barrels per day, 4.8% above the same four-week period last year. ...

U.S. commercial crude oil inventories (excluding those in the Strategic Petroleum Reserve) increased by 10.9 million barrels from the previous week. At 482.4 million barrels, U.S. crude oil inventories are at the highest level for this time of year in at least the last 80 years.It is difficult to forecast oil and gasoline prices due to world events - and the response of producers to price changes, but currently the EIA expects gasoline prices to average $2.40/gal in 2015 according to the Short Term Energy Outlook released last week:
emphasis added
• On April 2, Iran and the five permanent members of the United Nations Security Council plus Germany (P5+1) reached a framework agreement that could result in the lifting of oil-related sanctions against Iran. Lifting sanctions could substantially change the STEO forecast for oil supply, demand, and prices by allowing a significantly increased volume of Iranian barrels to enter the market. If and when sanctions are lifted, the baseline forecast for world crude oil prices in 2016 could be reduced $5-$15/barrel (bbl) from the level presented in this STEO. ...
• Iran is believed to hold at least 30 million barrels in storage, and EIA believes Iran has the technical capability to ramp up crude oil production by at least 700,000 bbl/day (bbl/d) by the end of 2016. The pace and magnitude at which those volumes would reach the market would depend on the terms of a final agreement. For additional analysis of the possible oil market effects of a lifting of sanctions against Iran, please see analysis box for further discussion.
...
• During the 2015 April-through-September summer driving season, regular gasoline retail prices are forecast to average $2.45/gallon (gal) compared with $3.59/gal last summer. Based on EIA's gasoline price forecast, the average U.S. household is expected to spend about $700 less on gasoline in 2015 compared with 2014, as annual motor fuel expenditures are on track to fall to their lowest level in 11 years.
emphasis added
 Click on graph for larger image
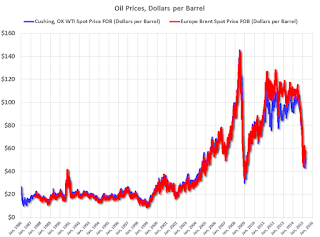
This graph shows WTI and Brent spot oil prices from the EIA. (Prices Friday added).
According to Bloomberg, WTI was at $51.64 per barrel on Friday, and Brent at $57.87.
WTI oil prices are off about 50% year-over-year.
Saturday, April 11, 2015
Schedule for Week of April 12, 2015
by Calculated Risk on 4/11/2015 10:31:00 AM
The key economic reports this week are March Retail sales on Tuesday, and March Housing Starts on Thursday.
For manufacturing, the March Industrial Production and Capacity Utilization report, and the April NY Fed (Empire State), and Philly Fed surveys, will be released this week.
For prices, March CPI will be released on Friday.
No economic releases scheduled.
8:30 AM ET: The Producer Price Index for March from the BLS. The consensus is for a 0.2% increase in prices, and a 0.1% increase in core PPI.
 8:30 AM ET: Retail sales for March will be released.
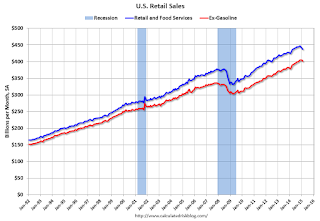
This graph shows retail sales since 1992 through February 2015. This is monthly retail sales and food service, seasonally adjusted (total and ex-gasoline). On a monthly basis, retail sales decreased 0.6% from January to February (seasonally adjusted), and sales were up 1.7% from February 2014.
The consensus is for retail sales to increase 1.0% in March, and to increase 0.7% ex-autos.
9:00 AM: NFIB Small Business Optimism Index for March.
10:00 AM: Manufacturing and Trade: Inventories and Sales (business inventories) report for February. The consensus is for a 0.2% increase in inventories.
7:00 AM: The Mortgage Bankers Association (MBA) will release the results for the mortgage purchase applications index.
8:30 AM: NY Fed Empire State Manufacturing Survey for April. The consensus is for a reading of 7.0, up from 6.9 last month (above zero is expansion).
 9:15 AM: The Fed will release Industrial Production and Capacity Utilization for March.
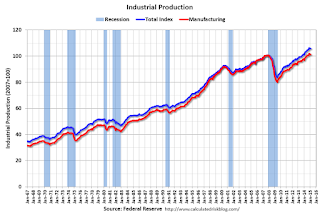
This graph shows industrial production since 1967.
The consensus is for a 0.3% decrease in Industrial Production, and for Capacity Utilization to decrease to 78.7%.
10:00 AM: The April NAHB homebuilder survey. The consensus is for a reading of 55, up from 53 last month. Any number above 50 indicates that more builders view sales conditions as good than poor.
2:00 PM: the Federal Reserve Beige Book, an informal review by the Federal Reserve Banks of current economic conditions in their Districts.
8:30 AM: The initial weekly unemployment claims report will be released. The consensus is for claims to decrease to 280 thousand from 281 thousand.
 8:30 AM: Housing Starts for March.
 Total housing starts decreased to 897 thousand (SAAR) in February. Single family starts declined to 593 thousand SAAR in February.
The consensus is for total housing starts to increase to 1.040 million (SAAR) in March.
10:00 AM: the Philly Fed manufacturing survey for March. The consensus is for a reading of 5.0, unchanged from 5.0 last month (above zero indicates expansion).
10:00 AM: the New York Fed to Host Press Briefing on Student Loans
8:30 AM: The Consumer Price Index for March from the BLS. The consensus is for a 0.3% increase in prices, and a 0.2% increase in core CPI.
10:00 AM: University of Michigan's Consumer sentiment index (preliminary for April). The consensus is for a reading of 93.7, up from 93.0 in March.
Friday, April 10, 2015
LA Times: Office Vacancy Rate Declines
by Calculated Risk on 4/10/2015 10:30:00 PM
Overall the office vacancy rate is falling, but still too high to spur a significant amount of new construction. However there are some submarkets that might see some new investment.
From Roger Vincent at the LA Times: L.A. County office market tightens in first quarter
Overall Los Angeles County vacancy fell to 16% in the first quarter from 18% in the same period a year earlier, according to the brokerage. Landlords raised their average asking rents 6%, to $2.73 per square foot a month.
But the county office market has many submarkets, among which demand and rent vary widely. The popular Westside, for example, has been improving for the last few years even as other submarkets, including downtown Los Angeles, were stagnant.
...
"We have a dozen submarkets below 10% vacancy now," [Petra Durnin, managing director of research for real estate brokerage Cushman & Wakefield] said. "That indicates the market strength we have been feeling is a reality."
Vacancy below 10% is considered a tight market, one that favors landlords in rent negotiations with tenants. Developers are also inclined to build new offices when vacancy falls below 10%, but so far there is little construction compared with other periods of prosperity in recent history.
No large office buildings came online in the first quarter, Durnin said, and only 1.5 million square feet of offices are under construction — a fraction of the existing inventory of 195.8 million square feet in L.A. County.
Lawler: Very Early Read on Existing Home Sales in March, "sizable monthly gain"
by Calculated Risk on 4/10/2015 03:59:00 PM
From housing economist Tom Lawler:
Based on the limited number of local realtor/MLS reports I’ve seen from across the country, I estimate that existing home sales as measured by the National Association of Realtors ran at a seasonally adjusted annual rate of about 5.10 million in March, up 4.5% from February’s pace and up 8.5% from last March’s seasonally-adjusted pace. Normally I wait until I have a larger sample of local reports to project the NAR sales number to publish a projection, and my “spot” estimate is subject to a wider-than-normal forecast error. I have, however, seen a sufficient number of reports to project that March existing home sales – again, as measured by the NAR – will show a sizable monthly gain.
On the inventory front, I project that the NAR’s measure of the inventory of existing homes for sale at the end of March will be 1.96 million, up 3.7% from February and unchanged from a year ago. Finally, I estimate that the NAR’s estimate of the median existing SF home sales price in March will be about 8% higher than a year earlier.
The NAR is scheduled to release its March existing home sales report on April 22nd. I will send out an updated projection near the middle of next week.
FNC: Residential Property Values increased 4.3% year-over-year in February
by Calculated Risk on 4/10/2015 01:11:00 PM
In addition to Case-Shiller, and CoreLogic, I'm also watching the FNC, Zillow and several other house price indexes.
FNC released their February 2015 index data today. FNC reported that their Residential Price Index™ (RPI) indicates that U.S. residential property values increased 0.6% from January to February (Composite 100 index, not seasonally adjusted).
The 10 city MSA, the 20-MSA and 30-MSA RPIs all increased by about 1% in February. These indexes are not seasonally adjusted (NSA), and are for non-distressed home sales (excluding foreclosure auction sales, REO sales, and short sales).
Notes: In addition to the composite indexes, FNC presents price indexes for 30 MSAs. FNC also provides seasonally adjusted data.
The year-over-year (YoY) change was about the same in February as in January, with the 100-MSA composite up 4.3% compared to February 2014. For FNC, the YoY increase has been slowing since peaking in March at 9.0%.
The index is still down 19.4% from the peak in 2006 (not inflation adjusted).

This graph shows the year-over-year change based on the FNC index (four composites) through February 2015. The FNC indexes are hedonic price indexes using a blend of sold homes and real-time appraisals.
Most of the other indexes are showing the year-over-year change mostly steady at around 5% for the last several months.
Note: The February Case-Shiller index will be released on Tuesday, Tuesday, April 28th.


