by Calculated Risk on 5/01/2015 07:11:00 AM
Friday, May 01, 2015
Zillow Forecast: Expect Case-Shiller National House Price Index up 4.2% year-over-year change in March
The Case-Shiller house price indexes for February were released this week. Zillow forecasts Case-Shiller a month early - now including the National Index - and I like to check the Zillow forecasts since they have been pretty close.
From Zillow: March Case-Shiller Forecast: 20-City Index to Show Annual Growth Above 5% Once Again
The February S&P/Case-Shiller (SPCS) data published today showed a slight uptick in home value appreciation for the 10- and 20-City indices, compared to the prior month. However, appreciation in the national index fell slightly in February, to an annual pace of 4.2 percent, from 4.4 percent in January 2015. Annual appreciation in the national series hit a post-bubble peak of 10.9 percent in October 2013 and has declined in every month since December 2013.So the year-over-year change in for March Case-Shiller National index will be about the same as in the February report.
The 10- and 20-City Composite Indices both experienced modest bumps in annual growth rates in February; the 10-City index rose 4.8 percent and the 20-City Index rose to 5 percent, up from rates of 4.3 percent and 4.5 percent, respectively, in January. The non-seasonally adjusted (NSA) 10- and 20-City indices were each up 0.5 percent in February from January, and we expect both to show further gains in March.
All forecasts are shown in the table below. These forecasts are based on the February SPCS data release and the March 2015 Zillow Home Value Index (ZHVI), published April 22. Officially, the SPCS Composite Home Price Indices for March will not be released until Tuesday, May 26.
| Zillow Case-Shiller Forecast | ||||||
|---|---|---|---|---|---|---|
| Case-Shiller Composite 10 | Case-Shiller Composite 20 | Case-Shiller National | ||||
| NSA | SA | NSA | SA | NSA | SA | |
| February Actual YoY | 4.8% | 4.8% | 5.0% | 5.0% | 4.2% | 4.2% |
| March Forecast YoY | 4.9% | 4.9% | 5.2% | 5.2% | 4.2% | 4.2% |
| March Forecast MoM | 0.9% | 1.0% | 1.0% | 0.9% | 0.5% | 0.2% |
From Zillow:
Annual appreciation in the Zillow Home Value Index (ZHVI) peaked in April 2014 and has declined since then. In March, the U.S. ZHVI rose 3.9 percent year-over-year, the first month in two years that home values grew at less than 4 percent annually. The annual appreciation rate in home values has fallen for the past 11 months. The February Zillow Home Value Forecast calls for a 2.6 percent rise in home values through February 2016. Further details on our forecast of home values can be found here.
Thursday, April 30, 2015
Friday: ISM Manufacturing, Auto Sales, Construction Spending
by Calculated Risk on 4/30/2015 09:00:00 PM
Fannie Mae reported today that the Single-Family Serious Delinquency rate declined in March to 1.78% from 1.83% in February. The serious delinquency rate is down from 2.19% in March 2014, and this is the lowest level since September 2008.
The Fannie Mae serious delinquency rate peaked in February 2010 at 5.59%.
Earlier Freddie Mac reported that the Single-Family serious delinquency rate was declined in March to 1.73%. Freddie's rate is down from 2.20% in March 2014, and is at the lowest level since December 2008. Freddie's serious delinquency rate peaked in February 2010 at 4.20%.
Note: These are mortgage loans that are "three monthly payments or more past due or in foreclosure".

The Fannie Mae serious delinquency rate has fallen 0.41 percentage points over the last year - the pace of improvement has slowed - and at that pace the serious delinquency rate will be close to 1% in late 2016.
The "normal" serious delinquency rate is under 1%, so maybe serious delinquencies will be close to normal at the end of 2016. This elevated delinquency rate is mostly related to older loans - the lenders are still working through the backlog, especially in judicial foreclosure states like Florida.
Friday:
• At 10:00 AM ET, ISM Manufacturing Index for April. The consensus is for an increase to 52.0 from 51.5 in March. The ISM manufacturing index indicated expansion at 51.5% in March. The employment index was at 50.0%, and the new orders index was at 51.8%.
• Also at 10:00 AM, Construction Spending for March. The consensus is for a 0.5% increase in construction spending.
• Also at 10:00 AM, University of Michigan's Consumer sentiment index (final for April). The consensus is for a reading of 96.0, up from the preliminary reading of 95.9, and up from the March reading of 93.0.
• All day: Light vehicle sales for April. The consensus is for light vehicle sales to decrease to 16.9 million SAAR in April from 17.05 million in March (Seasonally Adjusted Annual Rate).
Q1 2015 GDP Details on Residential and Commercial Real Estate
by Calculated Risk on 4/30/2015 05:25:00 PM
The BEA released the underlying details for the Q1 advance GDP report today.
Yesterday, the BEA reported that investment in non-residential structures decreased at a 23.1% annual rate in Q1.
All of the decline could be attributed to less petroleum exploration and less investment in electrical. Both declined at a 50% annual rate in Q1.
There was some weakness in lodging investment, but that might be weather related. Excluding petroleum and electrical, non-residential investment in structures was unchanged in Q1.

The first graph shows investment in offices, malls and lodging as a percent of GDP. Office, mall and lodging investment has increased a little recently, but from a very low level.
Investment in offices increased slightly in Q1, is down about 43% from the recent peak (as a percent of GDP) and increasing from a very low level - and is still below the lows for previous recessions (as percent of GDP). With the high office vacancy rate, office investment will only increase slowly.
Investment in multimerchandise shopping structures (malls) peaked in 2007 and is down about 59% from the peak. The vacancy rate for malls is still very high, so investment will probably stay low for some time.
Lodging investment declined in Q1, but with the hotel occupancy rate near record levels, it is likely that hotel investment will increase in the near future. Lodging investment peaked at 0.31% of GDP in Q3 2008 and is down about 65%.

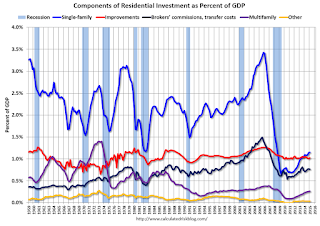
Investment in single family structures is now back to being the top category for residential investment. Home improvement was the top category for twenty consecutive quarters following the housing bust ... but now investment in single family structures has been back on top for the last 6 quarters and will probably stay there for a long time.
However - even though investment in single family structures has increased from the bottom - single family investment is still very low, and still below the bottom for previous recessions as a percent of GDP. I expect further increases over the next few years.
Investment in single family structures was $204 billion (SAAR) (over 1.1% of GDP).
Investment in home improvement was at a $182 billion Seasonally Adjusted Annual Rate (SAAR) in Q1 (just over 1.0% of GDP).
These graphs show investment is generally increasing, but from a very low level.
Lawler: More Builder Results (updated table)
by Calculated Risk on 4/30/2015 03:13:00 PM
Housing economist Tom Lawler sent me this updated table of builder results for Q1.
For these seven builders, net orders were up 19.9% year-over-year. Although cancellations are handled differently, this is about the same year-over-year increase for Q1 as for New Home sales as reported by the Census Bureau.
The average closing price is only up slightly this year following a sharp increase in 2014.
From Tom Lawler:
Net orders per active community for the seven builders combined were up 13.5% YOY, while their combined order backlog at the end of March was up 13.8% YOY.
| Net Orders | Settlements | Average Closing Price | |||||||
|---|---|---|---|---|---|---|---|---|---|
| Qtr. Ended: | 3/15 | 3/14 | % Chg | 3/15 | 3/14 | % Chg | 3/15 | 3/14 | % Chg |
| D.R. Horton | 11,135 | 8,569 | 29.9% | 8,243 | 6,194 | 33.1% | $281,305 | 271,230 | 3.7% |
| PulteGroup | 5,139 | 4,863 | 5.7% | 3,365 | 3,436 | -2.1% | $323,000 | 317,000 | 1.9% |
| NVR | 3,926 | 3,325 | 18.1% | 2,534 | 2,211 | 14.6% | $371,000 | 361,400 | 2.7% |
| The Ryland Group | 2,389 | 2,186 | 9.3% | 1,463 | 1,470 | -0.5% | $343,000 | 327,000 | 4.9% |
| Beazer Homes | 1,698 | 1,390 | 22.2% | 936 | 977 | -4.2% | $305,800 | 272,400 | 12.3% |
| Meritage Homes | 1,979 | 1,525 | 29.8% | 1,335 | 1,109 | 20.4% | $387,000 | 366,000 | 5.7% |
| M/I Homes | 1,108 | 982 | 12.8% | 717 | 732 | -2.0% | $325,000 | 299,000 | 8.7% |
| Total | 27,374 | 22,840 | 19.9% | 18,593 | 16,129 | 15.3% | $316,437 | $306,271 | 3.3% |
Earlier from the BEA: Personal Income increased slightly in March, Core PCE prices up 1.3% year-over-year
by Calculated Risk on 4/30/2015 11:40:00 AM
Earlier the BEA released the Personal Income and Outlays report for March:
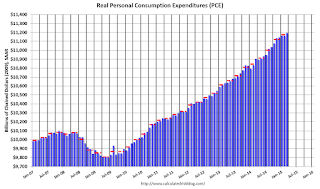
Personal income increased $6.2 billion, or less than 0.1 percent ... in March, according to the Bureau of Economic Analysis. Personal consumption expenditures (PCE) increased $53.4 billion, or 0.4 percent.The following graph shows real Personal Consumption Expenditures (PCE) through March 2015 (2009 dollars). Note that the y-axis doesn't start at zero to better show the change.
...
Real PCE -- PCE adjusted to remove price changes -- increased 0.3 percent in March, in contrast to a decrease of less than 0.1 percent in February. ... The price index for PCE increased 0.2 percent in March, the same increase as in February. The PCE price index, excluding food and energy, increased 0.1 percent in March, the same increase as in February.
The March price index for PCE increased 0.3 percent from March a year ago. The March PCE price index, excluding food and energy, increased 1.3 percent from March a year ago.
 Click on graph for larger image.
The dashed red lines are the quarterly levels for real PCE.
On inflation: the PCE price index as up 0.3% year-over-year (the decline in oil prices pushed down the headline price index). However core PCE is only up 1.3% year-over-year - still way below the Fed's target.


