by Calculated Risk on 5/02/2015 09:55:00 AM
Saturday, May 02, 2015
Schedule for Week of May 3, 2015
The key report this week is the April employment report on Friday.
Other key indicators include the March Trade Deficit on Tuesday, and the April ISM non-manufacturing index also on Tuesday.
Early: the Black Knight March Mortgage Monitor report. This is a monthly report of mortgage delinquencies and other mortgage data.
10:00 AM: Manufacturers' Shipments, Inventories and Orders (Factory Orders) for March. The consensus is a 2.1% increase in orders.
2:00 PM ET: the April 2015 Senior Loan Officer Opinion Survey on Bank Lending Practices from the Federal Reserve.
 8:30 AM: Trade Balance report for March from the Census Bureau.
 This graph shows the U.S. trade deficit, with and without petroleum, through February. The blue line is the total deficit, and the black line is the petroleum deficit, and the red line is the trade deficit ex-petroleum products.
The consensus is for the U.S. trade deficit to be at $42.0 billion in March from $35.4 billion in February. Note: The trade deficit probably increased sharply in March after the West Coast port slowdown was resolved in February. It seems likely the deficit will be larger than the "consensus" forecast.
10:00 AM: the ISM non-Manufacturing Index for April. The consensus is for index to decrease to 56.2 from 56.5 in March.
7:00 AM: The Mortgage Bankers Association (MBA) will release the results for the mortgage purchase applications index.
8:15 AM: The ADP Employment Report for April. This report is for private payrolls only (no government). The consensus is for 205,000 payroll jobs added in April, up from 189,000 in March.
9:15 AM: Speech by Fed Chair Janet Yellen, Finance and Society, At the Institute for New Economic Thinking Conference on Finance and Society, Washington, D.C.
8:30 AM: The initial weekly unemployment claims report will be released. The consensus is for claims to increase to 285 thousand from 262 thousand.
3:00 PM: Consumer Credit for March from the Federal Reserve. The consensus is for an increase of $16.0 billion in credit.
8:30 AM: Employment Report for April. The consensus is for an increase of 220,000 non-farm payroll jobs added in April, up from the 126,000 non-farm payroll jobs added in March.
The consensus is for the unemployment rate to decline to 5.4%.
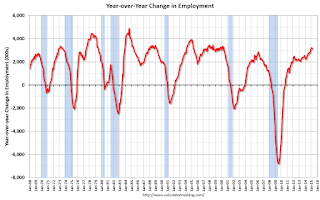
 This graph shows the year-over-year change in total non-farm employment since 1968.
In March, the year-over-year change was 3.1 million jobs.
As always, a key will be the change in real wages - and as the unemployment rate falls, wage growth should pickup.
Friday, May 01, 2015
Restaurant Performance Index shows Expansion in March
by Calculated Risk on 5/01/2015 07:02:00 PM
Here is a minor indicator I follow from the National Restaurant Association: Restaurant Performance Index Remained Positive in March
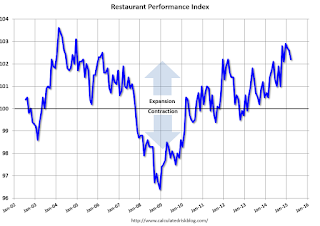
As a result of higher same-store sales and a continued optimistic outlook for future business conditions, the National Restaurant Association’s Restaurant Performance Index (RPI) remained in positive territory in March. The RPI – a monthly composite index that tracks the health of and outlook for the U.S. restaurant industry – stood at 102.2 in March, down 0.4 percent from February’s level of 102.6. Despite the decline, March marked the 25th consecutive month in which the RPI stood above 100, which signifies expansion in the index of key industry indicators.
“Although a majority of restaurant operators reported higher same-store sales in March, customer traffic levels were somewhat dampened,” said Hudson Riehle, senior vice president of the Research and Knowledge Group for the Association. “Looking forward, restaurant operators remain solidly optimistic about future business conditions, with six in 10 expecting to have higher sales in six months.”
emphasis added
 Click on graph for larger image.
The index decreased to 102.2 in March, down from 102.6 in February. (above 100 indicates expansion).
Restaurant spending is discretionary, so even though this is "D-list" data, I like to check it every month. This is another solid reading - and it is likely restaurants are benefiting from lower gasoline prices and are having to raise wages - a little - to attract and retain workers.
U.S. Light Vehicle Sales declined to 16.5 million annual rate in April
by Calculated Risk on 5/01/2015 02:38:00 PM
Based on a WardsAuto estimate, light vehicle sales were at a 16.5 million SAAR in April. That is up 3.3% from April 2014, and down 3.2% from the 17.05 million annual sales rate last month.
Click on graph for larger image.
This graph shows the historical light vehicle sales from the BEA (blue) and an estimate for April (red, light vehicle sales of 16.5 million SAAR from WardsAuto).
This was below the consensus forecast of 16.9 million SAAR (seasonally adjusted annual rate).
The second graph shows light vehicle sales since the BEA started keeping data in 1967.

Although below the consensus forecast, this was still a solid month for vehicle sales.
Construction Spending decreased 0.6% in March
by Calculated Risk on 5/01/2015 12:12:00 PM
Earlier today, the Census Bureau reported that overall construction spending decreased in March:
The U.S. Census Bureau of the Department of Commerce announced today that construction spending during March 2015 was estimated at a seasonally adjusted annual rate of $966.6 billion, 0.6 percent below the revised February estimate of $972.9 billion. The March figure is 2.0 percent above the March 2014 estimate of $947.3 billion.Both Private and public spending decreased:
Spending on private construction was at a seasonally adjusted annual rate of $702.4 billion, 0.3 percent below the revised February estimate of $704.7 billion. ...Note: Non-residential for offices and hotels is generally increasing, but spending for oil and gas is declining. Early in the recovery, there was a surge in non-residential spending for oil and gas (because oil prices increased), but now, with falling prices, oil and gas is a drag on overall construction spending.
In March, the estimated seasonally adjusted annual rate of public construction spending was $264.2 billion, 1.5 percent below the revised February estimate of $268.2 billion.
emphasis added
As an example, construction spending for lodging is up 22% year-over-year, whereas spending for power (includes oil and gas) construction peaked in mid-2014 and is down 16% year-over-year.
 Click on graph for larger image.
This graph shows private residential and nonresidential construction spending, and public spending, since 1993. Note: nominal dollars, not inflation adjusted.
Private residential spending has been moving sideways, and is 48% below the bubble peak.
Non-residential spending is 15% below the peak in January 2008.
Public construction spending is now 19% below the peak in March 2009 and about 1% above the post-recession low.
 The second graph shows the year-over-year change in construction spending.
On a year-over-year basis, private residential construction spending is down 2.5%. Non-residential spending is up 9% year-over-year. Public spending is unchanged year-over-year.
Looking forward, all categories of construction spending should increase in 2015. Residential spending is still very low, non-residential is starting to pickup (except oil and gas), and public spending has probably hit bottom after several years of austerity.
This was below the consensus forecast of a 0.5% increase, however spending for January and February was revised up.
ISM Manufacturing index unchanged at 51.5 in April
by Calculated Risk on 5/01/2015 10:01:00 AM
The ISM manufacturing index suggested sluggish expansion in April. The PMI was at 51.5% in April, unchanged from 51.5% in March. The employment index was at 48.3%, down from 50.0% in March, and the new orders index was at 53.5%, up from 51.8%.
From the Institute for Supply Management: April 2015 Manufacturing ISM® Report On Business®
Economic activity in the manufacturing sector expanded in April for the 28th consecutive month, and the overall economy grew for the 71st consecutive month, say the nation’s supply executives in the latest Manufacturing ISM® Report On Business®.
The report was issued today by Bradley J. Holcomb, CPSM, CPSD, chair of the Institute for Supply Management® (ISM®) Manufacturing Business Survey Committee. "The April PMI® registered 51.5 percent, the same reading as in March. The New Orders Index registered 53.5 percent, an increase of 1.7 percentage points from the reading of 51.8 percent in March. The Production Index registered 56 percent, 2.2 percentage points above the March reading of 53.8 percent. The Employment Index registered 48.3 percent, 1.7 percentage points below the March reading of 50 percent, reflecting contracting employment levels from March. Inventories of raw materials registered 49.5 percent, a decrease of 2 percentage points from the March reading of 51.5 percent. The Prices Index registered 40.5 percent, 1.5 percentage points above the March reading of 39 percent, indicating lower raw materials prices for the sixth consecutive month. While the March and April PMI® were equal, both registering 51.5 percent, 15 of the 18 manufacturing industries reported growth in April while only 10 industries reported growth in March, indicating a broader distribution of growth in April among the 18 industries."
emphasis added
 Click on graph for larger image.
Here is a long term graph of the ISM manufacturing index.
This was below expectations of 52.0%, but still indicates expansion in April.


