by Calculated Risk on 5/05/2015 10:05:00 AM
Tuesday, May 05, 2015
ISM Non-Manufacturing Index increased to 57.8% in April
The April ISM Non-manufacturing index was at 57.8%, up from 56.5% in March. The employment index increased in April to 56.7%, up slightly from 56.6% in March. Note: Above 50 indicates expansion, below 50 contraction.
From the Institute for Supply Management: April 2015 Non-Manufacturing ISM Report On Business®
Economic activity in the non-manufacturing sector grew in April for the 63rd consecutive month, say the nation’s purchasing and supply executives in the latest Non-Manufacturing ISM® Report On Business®.
The report was issued today by Anthony Nieves, CPSM, C.P.M., CFPM, chair of the Institute for Supply Management® (ISM®) Non-Manufacturing Business Survey Committee. "The NMI® registered 57.8 percent in April, 1.3 percentage points higher than the March reading of 56.5 percent. This represents continued growth in the non-manufacturing sector. The Non-Manufacturing Business Activity Index increased substantially to 61.6 percent, which is 4.1 percentage points higher than the March reading of 57.5 percent, reflecting growth for the 69th consecutive month at a faster rate. The New Orders Index registered 59.2 percent, 1.4 percentage points higher than the reading of 57.8 percent registered in March. The Employment Index increased 0.1 percentage point to 56.7 percent from the March reading of 56.6 percent and indicates growth for the 14th consecutive month. The Prices Index decreased 2.3 percentage points from the March reading of 52.4 percent to 50.1 percent, indicating prices increased in April for the second consecutive month, but at a slower rate. According to the NMI®, 14 non-manufacturing industries reported growth in April. The majority of respondents indicate that there has been an uptick in business activity due to the improved economic climate and prevailing stability in business conditions."
emphasis added
 Click on graph for larger image.
This graph shows the ISM non-manufacturing index (started in January 2008) and the ISM non-manufacturing employment diffusion index.
This was above the consensus forecast of 57.8% and suggests faster expansion in April than in March. Overall this was a solid report.
Trade Deficit increased in March to $51.4 Billion
by Calculated Risk on 5/05/2015 08:43:00 AM
The Department of Commerce reported:
The U.S. Census Bureau and the U.S. Bureau of Economic Analysis, through the Department of Commerce, announced today that the goods and services deficit was $51.4 billion in March, up $15.5 billion from $35.9 billion in February, revised. March exports were $187.8 billion, $1.6 billion more than February exports. March imports were $239.2 billion, $17.1 billion more than February imports.The trade deficit much larger than the consensus forecast of $42.0 billion.
The first graph shows the monthly U.S. exports and imports in dollars through March 2015.
 Click on graph for larger image.
Imports and exports increased in March ( due a bounce back following the resolution of the West Coast port slowdown).
Exports are 13% above the pre-recession peak and down 3% compared to March 2014; imports are 3% above the pre-recession peak, and up 1% compared to March 2014.
The second graph shows the U.S. trade deficit, with and without petroleum.
 The blue line is the total deficit, and the black line is the petroleum deficit, and the red line is the trade deficit ex-petroleum products.
Oil imports averaged $46.47 in March, down from $49.53 in February, and down from $93.91 in March 2014. The petroleum deficit has generally been declining and is the major reason the overall deficit has declined since early 2012.
The trade deficit with China increased to $31.2 billion in March, from $20.4 billion in March 2014. Much of this increase was due to unloading all the ships backed up at West Coast ports. The deficit with China is a large portion of the overall deficit.
Note: The deficit was larger than the BEA assumed for the advance GDP estimate, and this suggests GDP be revised down for Q1.
Monday, May 04, 2015
Tuesday: Trade Deficit, ISM non-Manufacturing Index
by Calculated Risk on 5/04/2015 08:06:00 PM
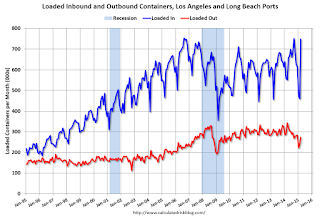
Note: West Coast port traffic increased sharply in March following the resolution of the labor issue in February. The workers were catching up with all the ships anchored in the harbor (now gone).
This graph is monthly for inbound and outbound traffic at the ports of Los Angeles and Long Beach in TEUs (TEUs: 20-foot equivalent units or 20-foot-long cargo container).
Both imports and exports rebounded in March, but imports rebounded more - and were up 36% year-over-year - whereas exports were down 20% year-over-year.
This suggests more imports from Asia in March, and also suggests the trade deficit was significantly higher in March than in February.
Tuesday:
• At 8:30 AM ET, Trade Balance report for March from the Census Bureau. The consensus is for the U.S. trade deficit to be at $42.0 billion in March from $35.4 billion in February.
• At 10:00 AM, the ISM non-Manufacturing Index for April. The consensus is for index to decrease to 56.2 from 56.5 in March.
Update: Framing Lumber Prices down Year-over-year
by Calculated Risk on 5/04/2015 05:15:00 PM
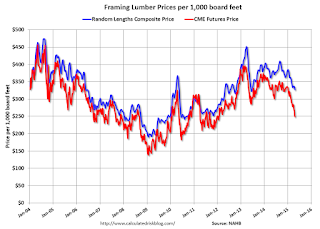
Here is another graph on framing lumber prices. Early in 2013 lumber prices came close to the housing bubble highs.
The price increases in early 2013 were due to a surge in demand (more housing starts) and supply constraints (framing lumber suppliers were working to bring more capacity online).
Prices didn't increase as much early in 2014 (more supply, smaller "surge" in demand), however prices didn't fall as sharply either.

This graph shows two measures of lumber prices: 1) Framing Lumber from Random Lengths through April 2015 (via NAHB), and 2) CME framing futures.
Right now Random Lengths prices are down about 11% from a year ago, and CME futures are down around 25% year-over-year.
Fed Survey: Banks ease Standards for Residential Mortgages, CRE Loans
by Calculated Risk on 5/04/2015 02:00:00 PM
From the Federal Reserve: The April 2015 Senior Loan Officer Opinion Survey on Bank Lending Practices
Regarding loans to businesses, the April survey results indicated that, on balance, banks reported little change in their standards on commercial and industrial (C&I) loans in the first quarter of 2015. On net, banks reported having eased some price terms. With respect to commercial real estate (CRE) lending, on balance, survey respondents reported having eased standards on loans secured by nonfarm nonresidential properties. A few large banks also indicated that they had eased standards on construction and land development loans, and some large banks reported that they had eased standards on loans secured by multifamily properties. In addition, survey respondents reported having eased some CRE loan terms, on net, over the past year. On the demand side, banks indicated having experienced little change in demand for C&I loans in the first quarter; in contrast, respondents reported stronger demand for all three categories of CRE loans covered in the survey.
The survey contained a set of special questions about lending to firms in the oil and natural gas drilling or extraction sector. Banks expected delinquency and charge-off rates on such loans to deteriorate over 2015, but they indicated that their exposures were small, and that they were undertaking a number of actions to mitigate the risk of loan losses.
Regarding loans to households, banks reported having eased lending standards for a number of categories of residential mortgage loans over the past three months on net. Most banks reported no change in standards and terms on consumer loans. On the demand side, moderate net fractions of banks reported stronger demand across most categories of home-purchase loans. Similarly, respondents experienced stronger demand for auto and credit card loans on balance.
emphasis added
 Click on graph for larger image.
Here are some charts from the Fed.
This graph shows the change in lending standards and for CRE (commercial real estate) loans.
Banks are loosening their standards for CRE loans, and for various categories of CRE (right half of graph). Multifamily is seeing slightly tighter standards.
The second graph shows the change in demand for CRE loans.
 Banks are seeing a pickup in demand for all categories of CRE.
This suggests that we will see a further increase in commercial real estate development.
Also the banks are easing credit a little for residential mortgages (see graph on page 3).


