by Calculated Risk on 5/08/2015 08:35:00 AM
Friday, May 08, 2015
April Employment Report: 223,000 Jobs, 5.4% Unemployment Rate
From the BLS:
Total nonfarm payroll employment increased by 223,000 in April, and the unemployment rate was essentially unchanged at 5.4 percent, the U.S. Bureau of Labor Statistics reported today. Job gains occurred in professional and business services, health care, and construction. Mining employment continued to decline.
...
The change in total nonfarm payroll employment for February was revised from +264,000 to +266,000, and the change for March was revised from +126,000 to +85,000. With these revisions, employment gains in February and March combined were 39,000 lower than previously reported.
emphasis added
 Click on graph for larger image.
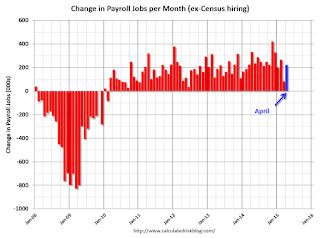
The first graph shows the monthly change in payroll jobs, ex-Census (meaning the impact of the decennial Census temporary hires and layoffs is removed - mostly in 2010 - to show the underlying payroll changes).
Total payrolls increased by 223 thousand in April (private payrolls increased 213 thousand).
Payrolls for February and March were revised down by a combined 39 thousand.
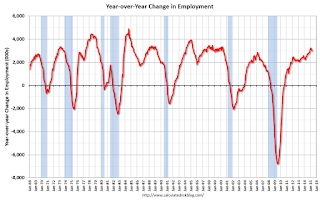
 This graph shows the year-over-year change in total non-farm employment since 1968.
In April, the year-over-year change was just under 3.0 million jobs.
This is a solid year-over-year gain.
 The third graph shows the employment population ratio and the participation rate.
The Labor Force Participation Rate increased in April to 62.8%. This is the percentage of the working age population in the labor force. A large portion of the recent decline in the participation rate is due to demographics.
The Employment-Population ratio was unchanged at 59.3% (black line).
I'll post the 25 to 54 age group employment-population ratio graph later.
 The fourth graph shows the unemployment rate.
 The unemployment rate was declined in April to 5.4%.
This was at expectations of 220,000, however there March was revised down ... still a decent report.
I'll have much more later ...
Thursday, May 07, 2015
Friday: Jobs, Jobs, Jobs
by Calculated Risk on 5/07/2015 07:42:00 PM
Here is the employment preview I posted earlier: Preview: Employment Report for April
Goldman Sachs is forecasting 230,000 jobs added, and for the unemployment rate to decline to 5.4%.
Merrill Lynch is forecasting 235,000 jobs added in April, and the unemployment rate declining to 5.4%.
Nomura is forecasting 210,000 jobs, a 0.28% increase in wages month-to-month, and a 5.4% unemployment rate.
Friday:
• At 8:30 AM ET, the Employment Report for April. The consensus is for an increase of 220,000 non-farm payroll jobs added in April, up from the 126,000 non-farm payroll jobs added in March. The consensus is for the unemployment rate to decline to 5.4%.
Phoenix Real Estate in April: Sales Up 9.3%, Inventory DOWN 13% Year-over-year
by Calculated Risk on 5/07/2015 05:31:00 PM
For the fifth consecutive month, inventory was down year-over-year in Phoenix. This is a significant change from last year.
This is a key distressed market to follow since Phoenix saw a large bubble / bust followed by strong investor buying. These key markets hopefully show us changes in trends for sales and inventory.
The Arizona Regional Multiple Listing Service (ARMLS) reports (table below):
1) Overall sales in April were up 9.3% year-over-year.
2) Cash Sales (frequently investors) were down to 25.3% of total sales.
3) Active inventory is now down 13.2% year-over-year.
More inventory (a theme in 2014) - and less investor buying - suggested price increases would slow sharply in 2014. And prices increases did slow.
Now, with falling inventory, prices might increase a little faster in 2015 (something to watch if inventory continues to decline).
| April Residential Sales and Inventory, Greater Phoenix Area, ARMLS | ||||||
|---|---|---|---|---|---|---|
| Sales | YoY Change Sales | Cash | Percent Cash | Inventory | YoY Change | |
| Apr-08 | 4,8751 | --- | 986 | 20.2% | 55,7261 | --- |
| Apr-09 | 8,564 | 75.7% | 3,464 | 40.4% | 44,165 | -20.7% |
| Apr-10 | 9,261 | 8.1% | 3,641 | 39.3% | 41,756 | -5.5% |
| Apr-11 | 9,328 | 0.7% | 4,489 | 48.1% | 34,515 | -17.3% |
| Apr-12 | 8,438 | -9.5% | 4,013 | 47.6% | 21,125 | -38.8% |
| Apr-13 | 8,744 | 3.6% | 3,670 | 42.0% | 20,083 | -4.9% |
| Apr-14 | 7,656 | -12.4% | 2,469 | 32.2% | 29,889 | 48.8% |
| Apr-15 | 8,368 | 9.3% | 2,120 | 25.3% | 25,950 | -13.2% |
| 1 April 2008 does not include manufactured homes, ~100 more | ||||||
Goldman Sachs April Employment Preview
by Calculated Risk on 5/07/2015 03:15:00 PM
Yesterday I discussed several indicators: Preview: Employment Report for April
Some excerpts from a research piece by Goldman Sachs economist David Mericle:
We expect nonfarm payroll job growth of 230k in April ... We expect the unemployment rate to decline by one-tenth to 5.4% and average hourly earnings to rise 0.2%.
...
Based on our method for estimating the payrolls effect of deviations in weather conditions from seasonal norms, we expect that warmer temperatures should be a substantial positive factor for April payrolls. The weeks leading into the March reference week were much colder than usual, while the weeks leading into the April reference period were quite a bit warmer than usual. Furthermore, the change in employment in both the construction and leisure and hospitality industries was about 30k below trend in March.
...
We also see some upside risk to our baseline forecast from a calendar effect. There were five rather than four weeks between the reference weeks for the March and April payrolls surveys this year. While the relevant history is limited and the BLS's seasonal adjustment procedure does attempt to control for the four-versus-five week effect, we have found that five-week Aprils tend to see above-trend payroll growth. Moreover, we have found that this calendar effect is not fully captured by other employment-related data. We expect an unusually large and positive calendar effect this month.
Part II: Demographics are Now Improving, Projections
by Calculated Risk on 5/07/2015 01:15:00 PM
Yesterday I pointed out that a blog post on demographics at the Financial Times would make more sense if it had been written a decade ago.
A decade ago it was obvious that demographics would be a drag on the economy. Even without the financial crisis, we would have expected a slowdown in growth.
But now the prime working age population is growing again, and we can expect growth to pick up over the next decade.
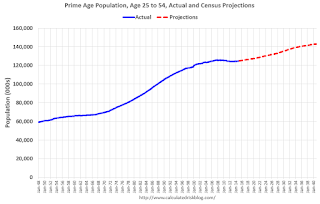
Here is a graph of the prime working age population (this is population, not the labor force) from 1948 through March 2015 - with projections from the Census Bureau through 2040.

In the '80s, the prime working age population was growing 2% or more per year. Over the last 10 years (March 2005 through March 2015), the prime working age population was mostly unchanged (up less than 1% for the decade).
That is key reason that growth has slowed (see Demographics and GDP: 2% is the new 4%). Add the residual effects of the financial crisis to the drag from demographics - and the last decade was no surprise.
Going forward, the prime working age population will grow at a 0.5% to 1.0% annual rate (Census projections). This isn't the 2%+ per year of the 1980s, but it is still decent growth.
Demographics are now improving in the U.S..


