by Calculated Risk on 5/15/2015 10:03:00 AM
Friday, May 15, 2015
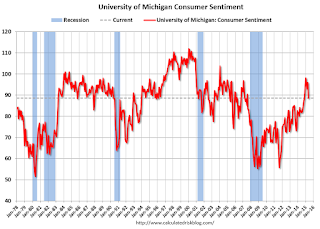
Preliminary May Consumer Sentiment declines to 88.6
Fed: Industrial Production decreased 0.3% in April
by Calculated Risk on 5/15/2015 09:23:00 AM
From the Fed: Industrial production and Capacity Utilization
Industrial production decreased 0.3 percent in April for its fifth consecutive monthly loss. Manufacturing output was unchanged in April after recording an upwardly revised gain of 0.3 percent in March. In April, the index for mining moved down 0.8 percent, its fourth consecutive monthly decrease; a sharp fall in oil and gas well drilling has more than accounted for the overall decline in mining this year. The output of utilities fell 1.3 percent in April. At 105.2 percent of its 2007 average, total industrial production in April was 1.9 percent above its year-earlier level. Capacity utilization for the industrial sector decreased 0.4 percentage point in April to 78.2 percent, a rate that is 1.9 percentage points below its long-run (1972–2014) average.
emphasis added
 Click on graph for larger image.
This graph shows Capacity Utilization. This series is up 11.3 percentage points from the record low set in June 2009 (the series starts in 1967).
Capacity utilization at 78.2% is 1.9% below the average from 1972 to 2012 and below the pre-recession level of 80.8% in December 2007.
Note: y-axis doesn't start at zero to better show the change.
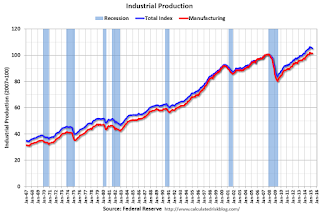
 The second graph shows industrial production since 1967.
Industrial production decreased 0.3% in April to 105.2. This is 25.6% above the recession low, and 4.4% above the pre-recession peak.
This was below expectations of no change, although March was revised up - and much of the decline over the last few months was due to the "a sharp fall in oil and gas well drilling".
Thursday, May 14, 2015
Friday: Industrial Production, Empire State Mfg, Consumer Sentiment
by Calculated Risk on 5/14/2015 06:43:00 PM
From Professor Tim Duy: Get Used To It
Bottom Line: We probably need to get used to the occasional negative GDP growth numbers in the context of overall expansion for the US economy. The concept of "stall speed" will need to be revised accordingly.Yes, due to demographics, 2% GDP growth is the new 4%.
Friday:
• At 8:30 AM ET, the NY Fed Empire State Manufacturing Survey for May. The consensus is for a reading of 5.0, up from -1.2 last month (above zero is expansion).
• At 9:15 AM, the The Fed will release Industrial Production and Capacity Utilization for April. The consensus is for no change in Industrial Production, and for Capacity Utilization to be unchanged at 78.4%.
At 10:00 AM, the University of Michigan's Consumer sentiment index (preliminary for May). The consensus is for a reading of 95.8, down from 95.9 in April.
Weekly Initial Unemployment Claims as a Percent of Labor Force
by Calculated Risk on 5/14/2015 03:21:00 PM
Earlier I mentioned that the 4-week moving average of weekly claims was the lowest since April 2000. And if the average falls just a little further, the average will be the lowest in over 40 years.
Of course that doesn't take into account the size of the labor force.
The following graph shows the 4-week moving average of weekly claims since 1967 as a percent of the labor force.
Click on graph for larger image.
As a percent of the labor force, weekly claims are at an all time record low.
Note: There is a general downward slope to weekly claims - interrupted by periods of recession. The downward slope is probably related to changes in hiring practices - such as background checks and drug tests, and maybe better planning.
CoStar: Commercial Real Estate prices increased in March
by Calculated Risk on 5/14/2015 01:11:00 PM
Here is a price index for commercial real estate that I follow.
From CoStar: Property Prices Surge Upward In the First Quarter Of 2015
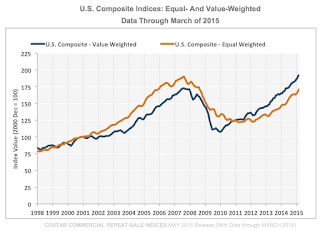
OMPOSITE PRICE INDICES CONTINUED TO RISE IN THE FIRST QUARTER OF 2015. ... The value-weighted U.S. Composite Index, which is influenced by high-quality assets in core markets, advanced by 4.7% in the first quarter of 2015 and is now 11% above the previous peak in 2007. The equal-weighted U.S. Composite Index, which weighs each transaction equally and therefore reflects the impact from more numerous smaller deals, rose 4.8% in the first quarter of 2015, although it remains 10% below its previous peak level.
ALL MAJOR PROPERTY TYPE AND REGIONAL INDICES ADVANCED AT DOUBLE- DIGIT ANNUAL RATES THROUGH MARCH 2015. As the CRE recovery extended to more markets and property types, all major property types and regional sectors posted double-digit annual gains through March 2015. The Multifamily Index has already fully recovered, eclipsing its previous peak, while the Retail and Industrial Indices advanced to within 10% of their previous peak levels and the Office Index remained 15% below its previous high-water mark in 2007. Among CCRSI’s regional indices, strong investor demand in core coastal metros propelled the Northeast Composite Index 6.1% above its prior peak, while the West Composite Index moved to within 8.4% of its prior peak in March 2015.
emphasis added
 Click on graph for larger image.
This graph from CoStar shows the the value-weighted U.S. Composite Index and the equal-weighted U.S. Composite Index indexes.
The value weighted index is at a record high, but the equal weighted is still 10.0% below the pre-recession peak.
There are indexes by sector and region too.
 The second graph shows the percent of distressed "pairs".
The distressed share is down from over 35% at the peak, but still a little elevated.
Note: These are repeat sales indexes - like Case-Shiller for residential - but this is based on far fewer pairs.


