by Calculated Risk on 11/11/2010 01:58:00 PM
Thursday, November 11, 2010
Labor Force Participation Rate: What will happen?
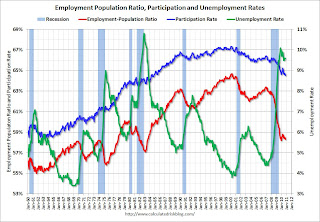
The collapse in the labor force participation rate has been one of the key stories of the great recession. The participation rate is the percentage of the working age population in the labor force.
As the economy slowly recovers, an important question is what will happen to the participation rate over the next few years? If the participation rate increases to 66% - from the current 64.5% - then the U.S. economy will need an additional 3.3 million jobs just to hold the unemployment rate steady (not counting population growth).
 Click on graph for larger image.
This graph shows the recent sharp decline in the participation rate (blue), and also the unemployment rate and the employment-population ratio. The participation rate had mostly been above 66% since the late '80s, and had been over 67% in the late '90s.
One of the key factors impacting the participation rate (other than a severe recession) is the age of the labor force. The following graph shows the participation rate by age group in 2007 (I selected 2007 because it is recent, but before the recession started).
 This graph is for 2007, but the general pattern holds for all years. The participation rate is low for those in the '16 to 19' age group. The rate increases sharply for those in the '20 to 24' age group, and the rate is at its peak from 25 to 49 - and drops off a little for the '50 to 54' age group.
After 55 workers start leaving the labor force, and the participation rate falls off with age.
Even if the participation rates per age group were static (they aren't), the overall participation rate would change with the demographics of the population.
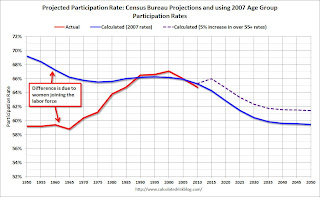
 We can use the above participation rates by age group for 2007, and historical data and age group population projections from the Census Bureau, to calculate a participation rate based on demographics.
This graph shows the calculated participation rate (blue) through 2050, and the actual participation rate since 1950 (red). The calculated participation rate, using 2007 data, is far too high for the earlier periods. This is mostly because of women joining the labor force (next graph).
Without other shifts in the labor force (last graph), the blue line would indicate the participation rate over the next 40 years. The participation rate declines as the population ages. This simple analysis suggests the participation rate will be at about the same level in 2015 as today.
Note: the dashed purple line indicates the participation rate with a 5 percentage point increase in the 'over 55' labor force participation rate.
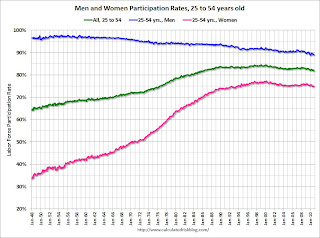
 The early gap in the previous graph was due to women joining the labor force (I used 2007 data to do the projections).
This graph shows the changes in the participation rates for men and women since 1960 (in the 25 to 54 age group - the prime working years).
The participation rate for women increased significantly from the mid 30s to the mid 70s. The participation rate for men has decreased from the high 90s to just about 90%.
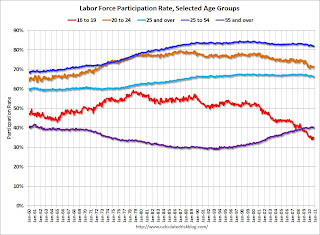
 And the final graph shows that participation rates for age groups are not static (as was assumed for the projection).
There are a few key trends happening:
1) the participation rate for the '16 to 19' age group has been falling for some time (red).
2) the participation rate for the 'over 55' age group has been rising since the mid '90s (purple).
3) the participation rate for the '20 to 24' age group appears to be falling too (perhaps more education before joining the labor force). Also note the sharp decline over the last couple of years - that will probably turn around quickly as the job market improves.
This is why I added the dashed purple line to the projection graph above. If the trend continues for the 'over 55' group - perhaps because of necessity, perhaps because of fewer "back breaking" jobs - then the overall participation rate will not fall as quickly as the blue line indicates. With just a 5 percentage point increase in participation for the 'over 55', the participation rate will be back to 66% in 2015.
Ireland: Bank funding problems?
by Calculated Risk on 11/11/2010 10:19:00 AM
Ireland is fully funded until mid-2011, however I've heard this morning that certain European investors are no longer willing to provide Irish banks with overnight funding. This could lead to a serious liquidity problem for the Irish banks - and some investors believe that Ireland may need to borrow from the IMF or the EFSF to support the banks.
And some comments from officials, first from the Financial Times: Barroso reaffirms offer of help to Ireland
José Manuel Barroso, European Commission president, said ... “What is important to know is that we have all the essential instruments in place in the European Union and eurozone to act if necessary, but I am not going to make any speculation”.Both the Irish Central bank governor Patrick Honohan (See: IMF would use same fiscal policy - Honohan) and the Irish Finance Minister Brian Lenihan said today they believe Ireland will not need help (See: Irish FinMin: c.bank comments not laying ground for help).
excerpt with permission
The Ireland 10-year bond yield is at 8.9%.
For much more on the problems for Ireland (and Portugal), see: Life on the Edge of the EFSF, by Elga Bartsch & Daniele Antonucci at Morgan Stanley.
Note: I've been using the 8% cost estimate for the EFSF from Wolfgang Munchau in the Financial Times. The Morgan Stanley analysts write that they "expect such a loan to carry an interest rate of 5-6.5% per annum".
This is similar to the 6% EFSF rate calculated by University College Dublin professor Karl Whelan: Borrowing Rates from The EFSF
RealtyTrac: Foreclosure Activity Decreases slightly in October
by Calculated Risk on 11/11/2010 08:24:00 AM
From RealtyTrac: Foreclosure Activity Decreases 4 Percent in October
RealtyTrac® ... today released its U.S. Foreclosure Market Report™ for October 2010, which shows foreclosure filings — default notices, scheduled auctions and bank repossessions — were reported on 332,172 properties in October, a 4 percent decrease from the previous month and almost exactly the same total reported in October 2009. ...The good news is the number of default notices is trending down, although that might pick up again as house prices decline.
“October marks the 20th consecutive month where over 300,000 U.S. homeowners received a foreclosure notice,” said James J. Saccacio, chief executive officer at RealtyTrac. “The numbers probably would have been higher except for the fallout from the recent 'robo-signing' controversy — which is the most likely reason for the 9 percent monthly drop in REOs we saw from September to October and which may result in further decreases in November."
...
A total of 100,575 U.S. properties received default notices (NOD, LIS) in October, a 2 percent decrease from the previous month and a 19 percent decrease from October 2009 — the ninth straight month where default notices have decreased on a year-over-year basis.
...
Lenders foreclosed on 93,236 U.S. properties in October, down 9 percent from the record high in the previous month but still up 21 percent from October 2009.
Wednesday, November 10, 2010
CSCO and KLIC: Weaker Outlooks
by Calculated Risk on 11/10/2010 10:15:00 PM
From Reuters: Cisco's dismal outlook stuns Street
On the conference call, CSCO guided lower and said public sector spending is slow. Management also said that Europe is seeing some declines - although it was too early to call it a trend. (ht Brian, JB)
And from the WSJ: Kulicke & Soffa 4Q Profit Soars; Shares Down On Weak 1Q View
Kulicke & Soffa Industries ... predicted revenue for the current quarter of $125 million to $135 million, far below analysts' average estimate of $214.6 million ...This might suggest a slowdown in equipment and software investment.
Lawler: Early Read on October Existing Home Sales
by Calculated Risk on 11/10/2010 06:18:00 PM
CR Note: This is from housing economist Tom Lawler:
Based on data available so far, it would appear as if national existing home sales in October ran at a seasonally adjusted annual rate that was little changed from September [4.53 million SAAR]. Of course, October’s YOY sales decline on an unadjusted basis is significantly larger than September’s. But October sales were significantly goosed (SAAR of 5.98 million) last October by the expiring (or so folks thought!) first time home buyer tax credit. In addition, there was one fewer business day this October than last October.
The incoming listings data have on average been consistent with the realtor.com data showing a 3.2% decline in existing home sales inventory in October.
CR Note: A 3.2% decline in inventory, and sales of 4.53 million SAAR would put the months-of-supply at about 10.4 months in October. That would be the fourth straight month of double digit supply.
Based on this early forecast, YoY sales would be off 24%, and inventory would be up close to 10% YoY.
Existing home sales for October will be released on Tuesday November 23rd at 10 AM ET.
European Debt Update
by Calculated Risk on 11/10/2010 04:05:00 PM
Note: Some people have asked why I've posted so often about Ireland the last few weeks, I think these hockey stick graphs show why ...
Ireland 10-year bond yield at 8.64%.
Portugal 10-year bond yield at 7.04%.
And for Spain, the 10-year bond yield has risen to 4.5%.
And for Greece, the yield is up to 11.55%.
From the WSJ: European Debt Markets Take Hits
And from the Financial Times: Irish bond yields leap after selling wave
Last week LCH.Clearnet warned investors of higher margin requirements to trade in Ireland’s debt. That went into effect today - here is the memo:
The margin required for positions of Irish government bonds will consequently be increased by 15% of net exposure ... The additional margin will be charged on net exposure at close of business on Thursday 11 November 2010 and will be reflected in a margin call on Friday 12 November 2010.There is no immediate liquidity crisis for Ireland (unlike for Greece earlier this year), but clearly bond investors are spooked by the discussions of bond holders having to take haircuts if there is a bailout. And if yields stay above 8% that increases the likelihood of Ireland using the European Financial Stability Facility (EFSF).


