by Calculated Risk on 12/03/2010 10:04:00 AM
Friday, December 03, 2010
Employment Summary and Part Time Workers, Unemployed over 26 Weeks
Here are a few more graphs based on the weak employment report ...
Percent Job Losses During Recessions
 Click on graph for larger image.
This graph shows the job losses from the start of the employment recession, in percentage terms - this time from the start of the recession.
In the previous post, the graph showed the job losses aligned at the bottom.
The dotted line shows payroll employment excluding temporary Census workers.
This is by far the worst post WWII employment recession.
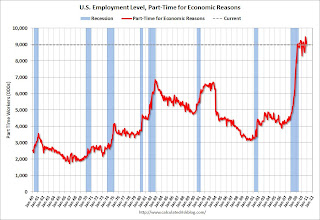
Part Time for Economic Reasons
 From the BLS report:
The number of persons employed part time for economic reasons (sometimes referred to as involuntary part-time workers) was little changed over the month at 9.0 million. These individuals were working part time because their hours had been cut back or because they were unable to find a full-time job.The number of workers only able to find part time jobs (or have had their hours cut for economic reasons) declined slightly to 8.972 million in November. This has been around 9 million since August 2009 - a very high level.
These workers are included in the alternate measure of labor underutilization (U-6) that was steady at 17.0% in November. The high for U-6 was 17.4% in October 2009. Still very grim.
Unemployed over 26 Weeks
 This graph shows the number of workers unemployed for 27 weeks or more.
 According to the BLS, there are 6.313 million workers who have been unemployed for more than 26 weeks and still want a job. This was up from 6.206 million in October. It appears the number of long term unemployed has peaked, however the level is extremely high - and the increases over the last two months is very concerning.
Summary
Perhaps the worst news was the jump in the unemployment rate to 9.8% without an increase in the participation rate. If the participation rate had increased, at least that would mean people were becoming more confident and rejoining the labor force. Instead the Labor Force Participation Rate was flat at 64.5% and this is a very low level. Note: This is the percentage of the working age population in the labor force (here is the graph in the galleries of the participation rate).
Most of the underlying details of the employment report were weak. The positives included small upward revisions to the September and October payroll reports, a slight increase in average hourly earnings, and a slight decline in part time workers.
The negatives include the unemployment rate increasing to 9.8%, few payroll jobs added (only 39,000 jobs), the decline in the employment-population ratio, the steady participation rate at a very low level, and the increase in workers unemployed for over 26 weeks.
• Earlier Employment post: November Employment Report: 39,000 Jobs, 9.8% Unemployment Rate
November Employment Report: 39,000 Jobs, 9.8% Unemployment Rate
by Calculated Risk on 12/03/2010 08:30:00 AM
From the BLS:
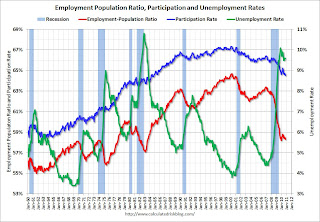
The unemployment rate edged up to 9.8 percent in November, and nonfarm payroll employment was little changed (+39,000), the U.S. Bureau of Labor Statistics reported today.The following graph shows the employment population ratio, the participation rate, and the unemployment rate.
 Click on graph for larger image.
The unemployment rate increased to 9.8% (red line).
The Employment-Population ratio declined to 58.2% in November matching the cycle low set in 2009 (black line).
The Labor Force Participation Rate was steady at 64.5% in November (blue line). This is the percentage of the working age population in the labor force. The participation rate is well below the 66% to 67% rate that was normal over the last 20 years.
 The second graph shows the job losses from the start of the employment recession, in percentage terms aligned at maximum job losses.
The dotted line is ex-Census hiring. The two lines have joined since the decennial Census is over.
For the current employment recession, employment peaked in December 2007, and this recession is by far the worst recession since WWII in percentage terms, and 2nd worst in terms of the unemployment rate (only the early '80s recession with a peak of 10.8 percent was worse).
This is a very disappointing employment report and far below expectations. I'll have much more soon ...
Thursday, December 02, 2010
Hotels: RevPAR up 10.1% compared to same week in 2009
by Calculated Risk on 12/02/2010 11:50:00 PM
From HotelNewsNow.com: STR: Upscale segment reports strong weekly gains
Overall, the industry’s occupancy increased 7.0% to 43.6%, ADR was up 2.9% to US$87.53, and RevPAR ended the week up 10.1% to US$38.16.The following graph shows the four week moving average for the occupancy rate by week for 2008, 2009 and 2010 (and a median for 2000 through 2007).
 Click on graph for larger image in new window.
Notes: the scale doesn't start at zero to better show the change. The graph shows the 4-week average, not the weekly occupancy rate.
On a 4-week basis, occupancy is up 8.2% compared to last year and 4.2% below the median for 2000 through 2007.
Note: For the first time this year, RevPAR (revenue per available room) was up compared to the same week two years ago (in 2008).
Data Source: Smith Travel Research, Courtesy of HotelNewsNow.com
European Bond Spreads, Dec 1, 2010
by Calculated Risk on 12/02/2010 06:33:00 PM
Here is a look at European bond spreads from the Atlanta Fed weekly Financial Highlights released today (graph as of Dec 1st):
 Click on graph for larger image in new window.
From the Atlanta Fed:
Led by Ireland, peripheral European bond spreads (over German bonds) have risen considerably in the past few weeks.Maybe the Atlanta Fed should add Belgium.
Since the November FOMC meeting, the 10-year Irish-to-German bond spread has risen by 142 basis points (bps) (from 6.32% to 4.90%), through November 29; spreads on Spanish debt are up 83 bps and 62 bps on Greek debt.
The spreads narrowed sharply today after ECB President Jean-Claude Trichet announced the ECB will extend special liquidity measures until at least April 12th - and continue the Securities Market Program (bond buying of euro-zone debt).
Unemployed: Longer out of work, tougher to find a job
by Calculated Risk on 12/02/2010 03:15:00 PM
An important article from Catherine Rampell at the NY Times: Persistence of Long-Term Unemployment Tests U.S.. A short excerpt:
New data from the Labor Department, provided to The New York Times, shows that people out of work fewer than five weeks are more than three times as likely to find a job in the coming month than people who have been out of work for over a year, with a re-employment rate of 30.7 percent versus 8.7 percent, respectively.This is why it is critical to help the unemployed. Rampell writes:
Likewise, previous economic studies, many based on Europe’s job market struggles, have shown that people who become disconnected from the work force have more trouble getting hired, probably because of some combination of stigma, discouragement and deterioration of their skills.
Direct employment programs — like the public works projects of the New Deal era and World War II — might be the fastest way to put people back to work, economists say. But those raise concerns of crowding out businesses and displacing other workers. Besides, such proposals, which smack of socialism to some, seem politically unfeasible at the moment.If structured correctly - in an environment with a 9.6% unemployment rate - the "crowding out" would be minimal. As far as the politics - well, I support a direct hiring program - and I have no expectation of it happening.
Employment Report Preview
by Calculated Risk on 12/02/2010 01:02:00 PM
The BLS will release the November Employment Report at 8:30 AM tomorrow. The consensus is for an increase of 145,000 payroll jobs in November, and for the unemployment rate to stay steady at 9.6%. Note: Bloomberg is listing the consensus as 168,000 payroll jobs, and an increase in the unemployment rate to 9.7%.
Most of the recent employment related reports have been slightly above expectations:
• ADP reported Private Employment increased by 93,000 in November, the largest gain in three years. This was well above expectations of 68,000 private sector jobs.
• The ISM manufacturing employment index decreased slightly to 57.5 from 57.7 in October. This still suggests some hiring in manufacturing (the ADP report showed manufacturing employment increased by 16,000 in November). Most of the regional Fed manufacturing surveys also showed an increase in employment in November.
• Weekly initial unemployment claims were down significantly from October.
 Click on graph for larger image in new window.
The average over the last 4 weeks was 431,000 initial claims per week.
For October the average was 456,500. Although still elevated, this suggests some pickup in hiring compared to October.
 • The Reuters/University of Michigan consumer sentiment index increased to 71.6 from 67.7 in October.
This graph shows the consumer sentiment index.
There is some correlation between consumer sentiment and employment, and although this increase in sentiment was minor (and sentiment is still low), this does suggest some improvement.
• As I mentioned last month, the decennial Census hiring and layoffs can be ignored. As of October, there were only 1 thousand temporary census workers remaining on the payroll.
• The unemployment rate is dependent on both job creation and the participation rate.
Usually the participation rate - the percent of the civilian population in the labor force - falls when the job market is weak. And a decline in the participation rate puts downward pressure on the unemployment rate (and the opposite is true when the participation rate increases).
Right now the participation rate is very low at 64.5%, and a further decline would be considered very bad employment news (even if the unemployment rate declined slightly). An increase in the participation rate (due to more confidence), could lead to an increase in the unemployment rate even as hiring improves.
 This graph shows the recent sharp decline in the participation rate (blue), and also the unemployment rate and the employment-population ratio. The participation rate had mostly been above 66% since the late '80s, and had been over 67% in the late '90s.
The participation rate probably increased in November, and this might have pushed the unemployment rate up to 9.7%.
For much more on the participation rate, see:
• Labor Force Participation Rate: What will happen?
• Labor Force Participation Trends, Over 55 Age Groups
Note: I think the participation rate will move back towards 66% over the next few years, even with an aging population.
• In October the seasonally adjusted unemployment rate was 9.644% unrounded (reported as 9.6%), so it won't take much of an increase to reach 9.7% for November.
• Bottom line: I think hiring improved in November (I'll take the over again on jobs), but the unemployment rate might have increased too (depending on the participation rate).


