by Calculated Risk on 12/06/2010 09:17:00 AM
Monday, December 06, 2010
Germany rejects calls for larger rescue fund and "E-Bonds"
The European finance ministers are meeting today in Brussels. As we discussed over the weekend, some ministers are pushing to increase the bailout fund and others are arguing for "E-bonds" - joint European government bonds. As expected, Germany reject both suggestions ...
From the Irish Times: Germany rejects calls over debt fund
German Chancellor Angela Merkel said she saw no need to increase the size of the bailout mechanism.The German view is the higher spreads are the penalty for bad behaviour.
Mrs Merkel also said the European Union treaty did not allow for issuing common bonds, which would anyway reduce the element of competition and the interest rate incentive for fiscal good behaviour.
The key 10-year bond yields fell sharply last week (Ireland, Portugal, Spain), but are up slightly today.
Sunday, December 05, 2010
Bernanke: Without Fed's actions, unemployment rate might have hit 25%
by Calculated Risk on 12/05/2010 09:06:00 PM
From the CBS 60 Minutes interview: Fed Chairman Bernanke On The Economy
CBS: In the panic of 2008, the Fed put up $3.3 trillion. And just this past week, the Fed revealed who got emergency help. ... it was a historic transfusion of cash in a global system that was bleeding to death. We asked Bernanke what would have happened if the Fed hadn't acted.Although we don't how bad it would have been, I've repeatedly praised the Fed's creative and aggressive liquidity efforts - once they finally understood what was happening. This was the Federal Reserve at its best (and they are constantly criticized for this effort).
Scott Pelley: What would unemployment be today?
Fed Chairman Bernanke: Unemployment would be much, much higher. It might be something like it was in the Depression. Twenty-five percent. We saw what happened when one or two large financial firms came close to failure or to failure. Imagine if ten or 12 or 15 firms had failed, which is where we almost were in the fall of 2008. It would have brought down the entire global financial system and it would have had enormous implications, very long-lasting implications for the global economy, not just the U.S. economy.
And on the Fed at its worst:
Pelley: Is there anything that you wish you'd done differently over these last two and a half years or so?Bernanke was flat out blind. Missing the housing bubble and inevitable financial impact was inexcusable. I criticized Bernanke repeatedly in 2005, 2006 and 2007 for not recognizing the serious problems with the economy. I ridiculed Bernanke's 2005 piece in the WSJ: The Goldilocks Economy and wrote then that Bernanke was "channeling Coolidge's [Dec 1928] monument to economic shortsightedness".
Bernanke: Well, I wish I'd been omniscient and seen the crisis coming, the way you asked me about, I didn't.
There is much more in the interview including comments on income inequality ... "Well, it’s a very bad development. It’s creating two societies." ... and on unemployment ... "At the rate we're going, it could be four, five years before we are back to a more normal unemployment rate."
As always, I suggest ignoring Bernanke's comments on the deficit.
Earlier:
• Summary for Week ending December 4th
• Schedule for Week of December 5th
Europe Update: The launch of "E-Bonds"?
by Calculated Risk on 12/05/2010 07:02:00 PM
The European finance ministers meet this week in Brussels. Some ministers are pushing to increase the bailout fund and others are arguing for "E-bonds" - joint European government bonds. Although the key 10-year bond yields fell sharply last week (Ireland, Portugal, Spain), the crisis is far from over. A couple of articles:
From Stephen Castle at the NY Times: Pressure Rises to Bolster European Bailout Fund
European finance ministers are under mounting pressure to significantly increase the €750 billion rescue fund for the currency union when they meet Monday. ... Didier Reynders, the Belgian finance minister, suggested over the weekend that the fund ... will have to be increased when it is made permanent after 2013, and that it may make little sense to wait until then to do it.From the Financial Times: Europe’s leaders at odds over bond plan
Jean-Claude Juncker, Luxembourg’s prime minister who also chairs meetings of eurozone finance ministers, and Giulio Tremonti, Italy’s finance minister, argue in Monday’s Financial Times that the launch of “E-bonds” would send a clear message to financial markets and European citizens about the “the irreversibility of the euro”.Good luck getting Germany on board.
excerpt with permission
Bank Failures per Week in 2010
by Calculated Risk on 12/05/2010 02:29:00 PM
I haven't updated this graph for some time ...
There have been 314 bank failures in this cycle (starting in 2007):
| FDIC Bank Failures by Year | |
|---|---|
| 2007 | 3 |
| 2008 | 25 |
| 2009 | 140 |
| 2010 | 149 |
| Total | 314 |
The FDIC has slowed down recently, and there are probably only two weeks left for bank closures this year. The 149 bank failures this year is the highest total since 1992 (181 bank failures).
Unfortunately banks are still being added to the unofficial problem bank list much faster than they are being removed ... so there are probably many more banks failures to come.
Earlier:
• Summary for Week ending December 4th
• Schedule for Week of December 5th
Summary for Week ending December 4th
by Calculated Risk on 12/05/2010 09:28:00 AM
Below is a summary of the previous week, mostly in graphs. Note: here is the economic schedule for the coming week.
• November Employment Report: 39,000 Jobs, 9.8% Unemployment Rate
The following graph shows the employment population ratio, the participation rate, and the unemployment rate.
 Click on graph for larger image in graph gallery.
The unemployment rate increased to 9.8% (red line) from 9.6% in October.
The Employment-Population ratio declined to 58.2% in November matching the cycle low set in 2009 (black line).
The Labor Force Participation Rate was steady at 64.5% in November (blue line). This is the percentage of the working age population in the labor force. The participation rate is well below the 66% to 67% rate that was normal over the last 20 years.
 The second graph shows the job losses from the start of the employment recession, in percentage terms aligned at maximum job losses.
For the current employment recession, employment peaked in December 2007, and this recession is by far the worst recession since WWII in percentage terms, and 2nd worst in terms of the unemployment rate (only the early '80s recession with a peak of 10.8 percent was worse).
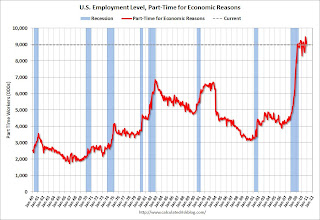
 The number of workers only able to find part time jobs (or have had their hours cut for economic reasons) declined slightly to 8.972 million in November. This has been around 9 million since August 2009 - a very high level.
These workers are included in the alternate measure of labor underutilization (U-6) that was steady at 17.0% in November. The high for U-6 was 17.4% in October 2009. Still very grim.
 This graph shows the number of workers unemployed for 27 weeks or more.
According to the BLS, there are 6.313 million workers who have been unemployed for more than 26 weeks and still want a job. This was up from 6.206 million in October. It appears the number of long term unemployed has peaked, however the level is extremely high - and the increases over the last two months is very concerning.
Most of the underlying details of the employment report were weak. The positives included small upward revisions to the September and October payroll reports, a slight increase in average hourly earnings, and a slight decline in part time workers.
The negatives include the unemployment rate increasing to 9.8%, few payroll jobs added (only 39,000 jobs), the decline in the employment-population ratio, the steady participation rate at a very low level, and the increase in workers unemployed for over 26 weeks.
• Case-Shiller: Broad-based Declines in Home Prices in Q3
S&P/Case-Shiller released the monthly Home Price Indices for September (actually a 3 month average of July, August and September). This includes prices for 20 individual cities, and two composite indices (10 cities and 20 cities), and the quarterly national index.
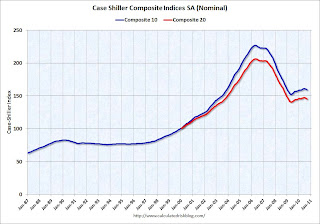
 This graph shows the nominal seasonally adjusted Composite 10 and Composite 20 indices (the Composite 20 was started in January 2000).
The Composite 10 index is off 29.8% from the peak, and down 0.7% in September(SA).
The Composite 20 index is off 29.6% from the peak, and down 0.8% in September (SA).
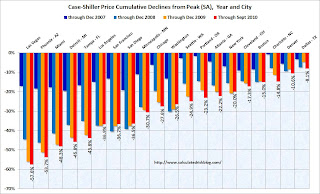
The next graph shows the price declines from the peak for each city included in S&P/Case-Shiller indices.
 Prices increased (SA) in only 1 of the 20 Case-Shiller cities in September seasonally adjusted. Only Wash, D.C. saw a price increase (SA) in September, and that was very small.
Prices in Las Vegas are off 57.6% from the peak, and prices in Dallas only off 8.1% from the peak.
Prices are now falling - and falling just about everywhere. And it appears there are more price declines coming (based on inventory levels and anecdotal reports).
• U.S. Light Vehicle Sales 12.26 million SAAR in November
Based on an estimate from Autodata Corp, light vehicle sales were at a 12.26 million SAAR in November. That is up 13.2% from November 2009, and up slightly from the October 2010 sales rate.
 This graph shows the historical light vehicle sales (seasonally adjusted annual rate) from the BEA (blue) and an estimate for November (red, light vehicle sales of 12.26 million SAAR from Autodata Corp).
This is the highest sales rate since September 2008, excluding Cash-for-clunkers in August 2009.
This was above most forecasts of around 12.0 million SAAR.
• ISM Manufacturing Index decreases slightly to 56.6 in November
From the Institute for Supply Management: November 2010 Manufacturing ISM Report On Business® PMI was at 56.6% in November, down slightly from 56.9% in October. The consensus was for a decrease to 56.5%.
 Here is a long term graph of the ISM manufacturing index.
In addition to the PMI, the ISM's new orders index was down to 56.6 from 58.9 in October.
The employment index decreased to 57.5 from 57.7 in October.
This was inline with the regional Fed manufacturing surveys.
• Other Economic Stories ...
• Restaurant Performance Index Rose to Three-Year High In October
• Hamilton: Europe and China: is this deja vu all over again?
• Michael Pettis: The rough politics of European adjustment.
• From Catherine Rampell at the NY Times: Persistence of Long-Term Unemployment Tests U.S.
• DOT: Vehicle miles driven increased in September
• From the Institute for Supply Management: October 2010 Non-Manufacturing ISM index showed expansion in November
• From the NAR:
Strong Rebound in Pending Home Sales
• ADP: Private Employment increased by 93,000 in November
• Unofficial Problem Bank list increases to 920 Institutions
Best wishes to all!
Saturday, December 04, 2010
Schedule for Week of December 5th
by Calculated Risk on 12/04/2010 08:45:00 PM
A light week for economic releases. The trade report on Friday is probably the key release ...
Note: Employment posts yesterday:
• November Employment Report: 39,000 Jobs, 9.8% Unemployment Rate
• Employment Summary and Part Time Workers, Unemployed over 26 Weeks
• Seasonal Retail Hiring: Retailers remain cautious
• Graphics Gallery for Employment
7:00 PM: Fed Chairman Bernanke discusses the economy on CBS 60 Minutes. This interview took place on November 30th.
1:15 PM Richmond Fed President Jeffrey Lacker speaks at Charlotte Chamber of Commerce's "Annual Economic Outlook Conference."
9:00 AM ET: Ceridian-UCLA Pulse of Commerce Index™ This is the diesel fuel index for November (a measure of transportation).
10:00 AM: Job Openings and Labor Turnover Survey for October from the BLS. This report has been showing a general increase in job openings, but very little turnover in the labor market.
3:00 PM: Consumer Credit for October. The consensus is for a $1 billion decline in consumer credit.
7:00 AM: The Mortgage Bankers Association (MBA) will release the mortgage purchase applications index. This index declined sharply following the expiration of the tax credit, and the index has only recovered slightly recently.
8:30 AM: The initial weekly unemployment claims report will be released. The number of initial claims has been trending down over the last several weeks. The consensus is for a decrease to 425,000 from 436,000 last week (still high, but lower than earlier this year).
10:00 AM: Monthly Wholesale Trade: Sales and Inventories for October. The consensus is 0.9% increase in inventories.
12:00 PM: Q3 Flow of Funds Accounts from the Federal Reserve.
8:30 AM: Trade Balance report for October from the Census Bureau. The consensus is for the U.S. trade deficit to be around $44 billion, the same level as in September.
9:55 AM: Reuters/University of Mich Consumer Sentiment preliminary for December. The consensus is for a slight increase to 72.5 from 71.6 in November.
After 4:00 PM: The FDIC might have a busy Friday afternoon ...


