by Calculated Risk on 12/07/2010 01:06:00 PM
Tuesday, December 07, 2010
Europe Update: More Stress Tests, Iceland out of recession
From the Financial Times: EU banks face new stress-tests
A new round of co-ordinated stress-tests on European banks would begin in February ... The “scope and methodology” of the new round of tests was still under discussion, [Olli Rehn, EU commissioner for economic and monetary affairs ]said, but should be disclosed fairly shortly.The last round of stress tests were heavily criticized - and all of the Irish banks passed the tests only to fail a few months later.
And from the NY Times: Iceland Breaks Out of Recession
Iceland broke out of recession in the third quarter of this year, official data showed Tuesday ... Unlike Ireland and Greece ... Iceland allowed private banks to fail, and its currency, the krona, has declined by about 46 percent against the dollar since the start of 2008.That isn't currently an option for Ireland, Greece, Portugal or Spain ...
BLS: Job Openings increase sharply in October, Labor Turnover still Low
by Calculated Risk on 12/07/2010 10:00:00 AM
From the BLS: Job Openings and Labor Turnover Summary
The number of job openings in October was 3.4 million, which was up
from 3.0 million in September. Since the most recent series trough in
July 2009, the number of job openings has risen by 1.0 million or 44
percent.
The following graph shows job openings (yellow line), hires (purple), Layoff, Discharges and other (red column), and Quits (light blue column) from the JOLTS.
Unfortunately this is a new series and only started in December 2000.
Note: The difference between JOLTS hires and separations is similar to the CES (payroll survey) net jobs headline numbers. This report is for October, the most recent employment report was for November.
 Click on graph for larger image in graphics gallery.
Notice that hires (purple) and total separations (red and blue columns stacked) are pretty close each month. When the purple line is above the two stacked columns, the economy is adding net jobs - when it is below the columns, the economy is losing jobs.
Note: The temporary decennial Census hiring and layoffs distorted this series over the summer months.
In October, about 4.047 million people lost (or left) their jobs, and 4.196 million were hired (this is the labor turnover in the economy) adding 149 thousand total jobs.
The good news is job openings is increasing, however overall labor turnover is still low.
Ceridian-UCLA: Diesel Fuel index increases slightly in November
by Calculated Risk on 12/07/2010 09:00:00 AM
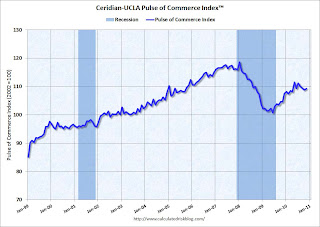
This is the new UCLA Anderson Forecast and Ceridian Corporation index using real-time diesel fuel consumption data: Pulse of Commerce IndexTM
 Click on graph for larger image in new window.
This graph shows the index since January 1999.
This is a new index, and doesn't have much of a track record in real time, although the data suggests the recovery has "stalled" since May.
Press Release: Inventory Movement Up Slightly in November in Still Fragile Market, Reports Latest Ceridian-UCLA Pulse of Commerce Index™
The Ceridian-UCLA Pulse of Commerce Index™ (PCI), a real-time measure of the flow of goods to U.S. factories, retailers, and consumers, grew 0.4 percent in November following three consecutive months of decline. The growth, while positive, is not enough to offset the 0.6 percent decline that the PCI saw the previous month, nor the 2.1 percent decline experienced in the PCI since July. Though on a year-over-year basis the PCI is up, the three month moving average has been declining for four months, suggesting relative weakness within the goods producing segments of the economy.Note:
“While the PCI’s most recent data shows growth, it is not substantial enough to offset the loss from the third quarter,” explained Ed Leamer, chief PCI economist and director of the UCLA Anderson Forecast. “In short, November’s “up” is relative to a low-bar so the growth is only mildly encouraging. The flatness we’re seeing with the latest PCI data reflects inventories in motion which seem to be signaling a weak fourth quarter.”
...
The Ceridian-UCLA Pulse of Commerce Index™ is based on real-time diesel fuel consumption data for over the road trucking ...
I'm not confident in using this index to forecast GDP growth, although it does appear to track Industrial Production over time (with plenty of noise).
Monday, December 06, 2010
Report: General Agreement on Taxes for next two years
by Calculated Risk on 12/06/2010 08:29:00 PM
The NY Times has the details: Pact on Bush Tax Cuts Trims Payroll Levy
A few points:
• Extend Bush income tax cuts for two years, including for high income earners.
• 13-month extension of jobless aid for the long-term unemployed. This isn't additional weeks of benefits for the '99ers - this is an extension of the qualification dates for existing tiers of extended unemployment benefits.
• Reducing the Social Security payroll tax by two percentage points for a year:
For a family earning $50,000, the two percentage point cut would mean a savings of $1,000.• Estate tax exemption of $5 million per person and a maximum rate of 35 percent.
For workers paying the maximum, the two percentage point cut would mean a savings of $2,136.
This is expected to increase the budget deficit by $900 billion over two years.
AAR: November Rail Traffic shows "mixed progress"
by Calculated Risk on 12/06/2010 05:15:00 PM
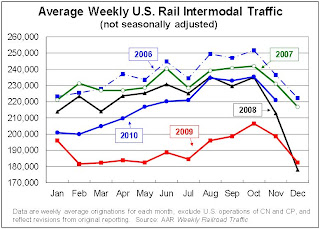
From the Association of American Railroads: AAR Reports November 2010 Rail Traffic Continues Mixed Progress. The AAR reports carload traffic in November 2010 was up 4.5% compared to November 2009, however carload traffic was still lower than in November 2008. Intermodal traffic (using intermodal or shipping containers) is up 11.3% over November 2009 and up slightly over November 2008.
"Even though U.S. rail volumes were down in November from October levels — due largely to Thanksgiving — November marks the 11th straight month in which rail volumes were higher than year-earlier levels. That hasn’t happened since January 2006," said AAR Senior Vice President John Gray. "Granted, 2009 was a bad year for rail traffic, but like the economy in general, rail traffic has been slowly improving. We’re hopeful that recent gains in consumer confidence and some recent encouraging signs regarding consumer spending will mean a continuation of economic growth and further growth in rail traffic."
While railroads continue to bring employees back to work and cars out of storage, data show the pace slowed slightly in recent months. During the month of October, the most recent period for industry employment data, railroads added 191 people to the employee rolls. Railroads brought 465 rail cars out of storage in November, with 317,810 cars, or roughly 20.8 percent of the North American railcar fleet, still in storage.
 Click on graph for larger image in new window.
This graph shows U.S. average weekly rail carloads (NSA). Traffic increased in 14 of 19 major commodity categories year-over-year.
From AAR:
• U.S. freight railroads originated an average of 284,407 carloads per week in November 2010 (see chart below left), for a total of 1,137,626 carloads for the month. That’s up 4.5% over November 2009. November was the ninth straight month with higher year-over-year average weekly rail carloads, something that hasn’t happened since 2004.As the first graph shows, rail carload traffic collapsed in November 2008, and now, over a year into the recovery, carload traffic has only recovered part way.
• On a seasonally adjusted basis, U.S. rail carloads were down 1.1% in November 2010 from October 2010. Seasonally-adjusted carloads on U.S. carriers have fallen (though by relatively small amounts) three of the past four months.
 The second graph is for intermodal traffic (using intermodal or shipping containers):
• On a non-seasonally adjusted basis, there is always a big decline in intermodal traffic in November from October, partly because many of the goods retailers stock for holiday sales are shipped in September and October and partly because of Thanksgiving. The week including Thanksgiving this year was the lowest-volume intermodal week of the year for U.S. railroads.The small seasonally adjusted declines suggest the recovery is very sluggish, or has even stalled, over the last few months.
• Seasonally adjusted U.S. rail intermodal traffic was down 0.4% in November 2010 from October 2010, its third straight monthly decline. As with carloads, recent declines have been small.
excerpts with permission
Note: The Ceridian-UCLA diesel fuel index for November will be released tomorrow.
Residential Investment and Unemployment
by Calculated Risk on 12/06/2010 01:10:00 PM
One of the key reasons for the sluggish recovery has been the ongoing problems in housing. Usually residential investment (RI) is a major contributor to GDP growth in the early stages of a recovery, but not this time because of the huge overhang of existing vacant homes.
Note: Residential investment (RI) includes new single family structures, multifamily structures, home improvement, broker's commissions, and a few minor categories.
 Click on graph for larger image in graphics gallery.
This graph shows RI and investment in single family structures as a percent of GDP. Usually RI rebounds strongly at the beginning of a recovery, but this time RI has continued to decline.
RI as a percent of GDP is at a post WWII low of 2.22%, and investment in single family structures is near the all time low.
Some people have asked how a sector that only accounts for 2.2% of GDP be so important? The answer is that usually RI accounts for a large percentage of the employment and GDP growth in the first year or so of a recovery. We can see this by looking at housing starts and the unemployment rate.
 This graph shows single family housing starts (through October) and the unemployment rate (inverted) through November. Note: Of course there are many other factors too, but housing is a key sector.
You can see both the correlation and the lag. The lag is usually about 12 to 18 months, with peak correlation at a lag of 16 months for single unit starts. The 2001 recession was a business investment led recession, and the pattern didn't hold.
Housing starts (blue) rebounded a little last year,and then moved sideways for some time, before declining again in May.
This is what I expected when I first posted the above graph in August 2009. I wrote:
[T]here is still far too much existing home inventory, a sharp bounce back in housing starts is unlikely, so I think ... a rapid decline in unemployment is also unlikely.I'm now looking at a 2011 forecast for housing, and the good news is RI should increase modestly next year. It will not be a vigorous recovery, but I do expect RI to make a positive contribution to GDP - and that is an improvement, and is one of the reasons I think real GDP growth in 2011 will be 3%+. Not great, but an improvement over 2010.


