by Calculated Risk on 12/10/2010 09:32:00 PM
Friday, December 10, 2010
Schedule for the Proposed Tax Legislation
The current plan is for the Senate to vote on the legislation on Monday at 3:00 pm. The House of Representatives is expected to vote later in the week, and then Congress plans to adjourn for the year on Friday.
From the LA Times: Sen. Bernie Sanders ends filibuster
Sen. Bernie Sanders (I-Vt.) has ended a marathon filibuster of the proposed tax compromise, ceding control of the Senate floor after more than 8 1/2 hours.I think so too, but it won't happen. This is basically a done deal.
"It has been a very long day," he said as he concluded his remarks, including a five-hour period in which he spoke without interruption. "... I think we can come up with a better proposal which better reflects the needs of the middle class."
Bank Failures #150 & 151: Michigan and Pennsylvania
by Calculated Risk on 12/10/2010 06:13:00 PM
Paramount's rising assets
Rolled over peak
Tremor in The Force
Earthstar has cleared the planet
Millions extinguished
by Soylent Green is People
From the FDIC: Level One Bank, Farmington Hills, Michigan, Assumes All of the Deposits of Paramount Bank, Farmington Hills, Michigan
As of September 30, 2010, Paramount Bank had approximately $252.7 million in total assets and $213.6 million in total deposits. ... The FDIC estimates that the cost to the Deposit Insurance Fund (DIF) will be $90.2 million. ... Paramount Bank is the 150th FDIC-insured institution to fail in the nation this year, and the fifth in Michigan.From the FDIC: Polonia Bank, Huntingdon Valley, Pennsylvania, Assumes All of the Deposits of Earthstar Bank, Southampton, Pennsylvania
As of September 30, 2010, Earthstar Bank had approximately $112.6 million in total assets and $104.5 million in total deposits. ... The FDIC estimates that the cost to the Deposit Insurance Fund (DIF) will be $22.9 million. ... Earthstar Bank is the 151st FDIC-insured institution to fail in the nation this year, and the second in Pennsylvania.The FDIC is back in action!
Under 35: Living with Parents vs. Homeownership rate
by Calculated Risk on 12/10/2010 03:52:00 PM
This interesting graph is from economist Tom Lawler comparing the percent of 24-34 year olds living at home vs. the under 35 year old homeownership rate ...
There is a clear inverse relationship, and this suggests some pent up demand for housing units when the employment picture improves (although the demand could be for rental units).
The Pain in Spain
by Calculated Risk on 12/10/2010 01:13:00 PM
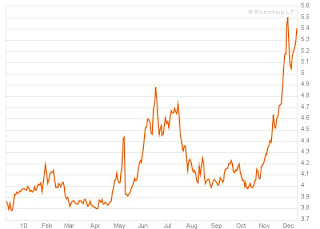
Just an update ... the yield on Spain's 10-year bond is rising again.
 This graph from Bloomberg shows the yield for Spain's 10-year bond over the last year. The yield was up to 5.4% today, just below the peak of 5.5% in late November.
The bond yields declined in July following the European bank stress tests, but most investors have lost confidence in those tests - and another round will be conducted early next year. But will the bond markets wait?
The yield on Portugal's 10-year bond is up to 6.27%.
Consumer Sentiment increases in December
by Calculated Risk on 12/10/2010 09:55:00 AM
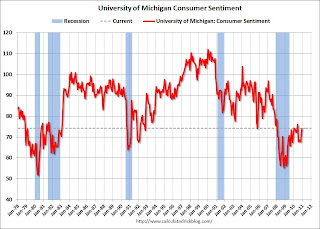
The preliminary Reuters / University of Michigan consumer sentiment index increased to 74.2 in December from 71.6 in November.
 Click on graph for larger image in graphics gallery.
This was above the consensus forecast of 72.5.
This is the highest level since June 2010, but sentiment is still at levels usually associated with a recession - and sentiment is well below the pre-recession levels.
In general consumer sentiment is a coincident indicator.
Trade Deficit decreases in October
by Calculated Risk on 12/10/2010 08:30:00 AM
The Census Bureau reports:
[T]otal October exports of $158.7 billion and imports of $197.4 billion resulted in a goods and services deficit of $38.7 billion, down from $44.6 billion in September, revised. October exports were $4.9 billion more than
September exports of $153.8 billion. October imports were $0.9 billion less than September imports of $198.4 billion.
 Click on graph for larger image.
The first graph shows the monthly U.S. exports and imports in dollars through October 2010.
After trade bottomed in the first half of 2009, imports increased much faster than exports. October exports were $4.9 billion more than in September and are at the highest level since August 2008.
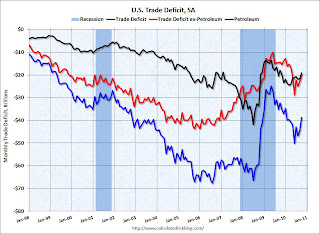
The second graph shows the U.S. trade deficit, with and without petroleum, through October.
 The blue line is the total deficit, and the black line is the petroleum deficit, and the red line is the trade deficit ex-petroleum products.
The petroleum deficit decreased slightly in September - even with higher prices - and the trade deficit with China decreased (NSA).
After stalling over the summer, it appears exports are growing again. I expect the dollar volume of oil imports to rise over the next couple of months since oil prices have increased sharply since October.


