by Calculated Risk on 12/14/2010 02:15:00 PM
Tuesday, December 14, 2010
FOMC Statement: No Change
• The target range for the federal funds rate remains at 0 to 1/4 percent
• The policy of reinvestment of principal payments remains
• no change to the plan to purchase an additional $600 billion of longer-term Treasury securities by the end of June 2011.
• the key sentence "likely to warrant exceptionally low levels for the federal funds rate for an extended period" remains
From the Federal Reserve:
Information received since the Federal Open Market Committee met in November confirms that the economic recovery is continuing, though at a rate that has been insufficient to bring down unemployment. Household spending is increasing at a moderate pace, but remains constrained by high unemployment, modest income growth, lower housing wealth, and tight credit. Business spending on equipment and software is rising, though less rapidly than earlier in the year, while investment in nonresidential structures continues to be weak. Employers remain reluctant to add to payrolls. The housing sector continues to be depressed. Longer-term inflation expectations have remained stable, but measures of underlying inflation have continued to trend downward.
Consistent with its statutory mandate, the Committee seeks to foster maximum employment and price stability. Currently, the unemployment rate is elevated, and measures of underlying inflation are somewhat low, relative to levels that the Committee judges to be consistent, over the longer run, with its dual mandate. Although the Committee anticipates a gradual return to higher levels of resource utilization in a context of price stability, progress toward its objectives has been disappointingly slow.
To promote a stronger pace of economic recovery and to help ensure that inflation, over time, is at levels consistent with its mandate, the Committee decided today to continue expanding its holdings of securities as announced in November. The Committee will maintain its existing policy of reinvesting principal payments from its securities holdings. In addition, the Committee intends to purchase $600 billion of longer-term Treasury securities by the end of the second quarter of 2011, a pace of about $75 billion per month. The Committee will regularly review the pace of its securities purchases and the overall size of the asset-purchase program in light of incoming information and will adjust the program as needed to best foster maximum employment and price stability.
The Committee will maintain the target range for the federal funds rate at 0 to 1/4 percent and continues to anticipate that economic conditions, including low rates of resource utilization, subdued inflation trends, and stable inflation expectations, are likely to warrant exceptionally low levels for the federal funds rate for an extended period.
The Committee will continue to monitor the economic outlook and financial developments and will employ its policy tools as necessary to support the economic recovery and to help ensure that inflation, over time, is at levels consistent with its mandate.
Voting for the FOMC monetary policy action were: Ben S. Bernanke, Chairman; William C. Dudley, Vice Chairman; James Bullard; Elizabeth A. Duke; Sandra Pianalto; Sarah Bloom Raskin; Eric S. Rosengren; Daniel K. Tarullo; Kevin M. Warsh; and Janet L. Yellen.
Voting against the policy was Thomas M. Hoenig. In light of the improving economy, Mr. Hoenig was concerned that a continued high level of monetary accommodation would increase the risks of future economic and financial imbalances and, over time, would cause an increase in long-term inflation expectations that could destabilize the economy.
Q3 2010: Mortgage Equity Withdrawal
by Calculated Risk on 12/14/2010 12:36:00 PM
Note: This is not Mortgage Equity Withdrawal (MEW) data from the Fed. The last MEW data from Fed economist Dr. Kennedy was for Q4 2008. My thanks to Jim Kennedy and the other Fed contributors for the previous MEW updates. For those interested in the last Kennedy data, here is a post, and the spreadsheet from the Fed is available here.
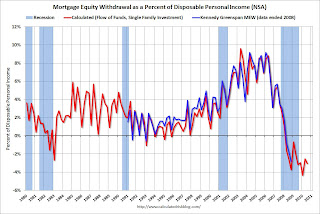
The following data is calculated from the Fed's Flow of Funds data and the BEA supplement data on single family structure investment. This is an aggregate number, and is a combination of homeowners extracting equity (hence the name "MEW", but there is little MEW right now!), normal principal payments and debt cancellation.
 Click on graph for larger image in new window.
For Q3 2010, the Net Equity Extraction was minus $86 billion, or a negative 3.0% of Disposable Personal Income (DPI). This is not seasonally adjusted.
This graph shows the net equity extraction, or mortgage equity withdrawal (MEW), results, using the Flow of Funds (and BEA data) compared to the Kennedy-Greenspan method.
The Fed's Flow of Funds report showed that the amount of mortgage debt outstanding declined sharply in Q3, and this was probably mostly because of debt cancellation per foreclosure and short sales, and some from modifications, as opposed to homeowners paying down their mortgages. Note: most homeowners pay down their principal a little each month unless they have an IO or Neg AM loan, so with no new borrowing, equity extraction would always be slightly negative.
Retail Sales increase 0.8% in November
by Calculated Risk on 12/14/2010 08:50:00 AM
On a monthly basis, retail sales increased 0.8% from October to November(seasonally adjusted, after revisions), and sales were up 7.7% from November 2009.
 Click on graph for larger image in new window.
This graph shows retail sales since 1992. This is monthly retail sales, seasonally adjusted (total and ex-gasoline).
Retail sales are up 12.8% from the bottom, and only off 0.3% from the pre-recession peak.
 The second graph shows the year-over-year change in retail sales (ex-gasoline) since 1993.
Retail sales ex-gasoline increased by 6.9% on a YoY basis (7.7% for all retail sales).
Here is the Census Bureau report:
The U.S. Census Bureau announced today that advance estimates of U.S. retail and food services sales for November, adjusted for seasonal variation and holiday and trading-day differences, but not for price changes, were $378.7 billion, an increase of 0.8 percent (±0.5%) from the previous month, and 7.7 percent (±0.7%) above November 2009. Total sales for the September through November 2010 period were up 7.8 percent (±0.5%) from the same period a year ago. The September to October 2010 percent change was revised from +1.2 percent (±0.5%) to +1.7 percent (±0.2%).This was above expectations for a 0.6% increase (and October was revised up). Retail sales ex-autos were up 1.2%, above expectations of a 0.6% increase.
Retail sales are almost back to the pre-recession peak in November 2007.
NFIB: Small Business optimism improves in November
by Calculated Risk on 12/14/2010 07:52:00 AM
From National Federation of Independent Business (NFIB): Small Business Optimism improves in November
Overall, small business owners continued to report more improvements in the economic environment, but the gains were small. The Index of Small Business Optimism gained 1.5 points, but the reading of 93.2 is still very weak, closer to a recession reading than indicative of a recovery. Although the November reading is higher than the prior 34 months, it is still lower than the November - December, 2007 readings by over a point, and those were the lowest 2007 readings as the Index fell all year signaling the coming end to the expansion in December. So the Index has climbed from its recession low of 81 but is far short of even the average value of the Index prior to the start of the recession, and far below values that have typified a recovery period.Note: Small businesses have a larger percentage of real estate and retail related companies than the overall economy.
 Click on graph for larger image in new window.
The first graph shows the small business optimism index since 1986. Although the index increased to 93.2 in November (highest since December 2007), it is still at recessionary level according to NFIB Chief Economist Bill Dunkelberg.
 The second graph shows the net hiring plans over the next three months.
Hiring plans have turned positive again and are the highest level since mid-2008. According to NFIB: "Over the next three months, nine percent plan to increase employment (up one point), and 12 percent plan to reduce their workforce (down one point), yielding a seasonally adjusted net four percent of owners planning to create new jobs, a three point gain from
October.."
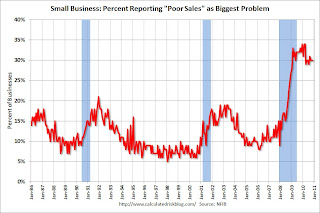
 And the third graph shows the percent of small businesses saying "poor sales" is their biggest problem.
Usually small business owners complain about taxes and regulations (that usually means business is good!), but now their self reported biggest problem is lack of demand.
Overall this survey is showing improvement, but at a very slow pace.
Monday, December 13, 2010
Tax Legislation passed cloture in Senate by 83 to 15 vote
by Calculated Risk on 12/13/2010 10:15:00 PM
The Senate voted 83 to 15 for cloture on the bill containing the proposed tax legislation. Here is the roll call. (This means further debate will be limited to 30 hours). The actual vote will probably be on Wednesday. The House is expected to vote later in the week.
And the economic schedule for tomorrow:
7:30 AM: NFIB Small Business Optimism Index for November. This index has been showing that small businesses remain pessimistic.
8:30 AM: Retail Sales for November. The consensus is for a 0.6% increase from October. (0.6% increases ex-auto).
8:30 AM: Producer Price Index for November. The consensus is for a 0.6% increase in producer prices.
10:00 AM: Monthly Wholesale Trade: Sales and Inventories for October. The consensus is for a 0.9% increase in inventories.
2:15 PM: FOMC Meeting Announcement. Here is a preview - no changes are expected to either interest rates or QE2.
Research Papers: Strategic Defaults on 2nds, and MBS "Skin in the Game"
by Calculated Risk on 12/13/2010 06:45:00 PM
A couple of new research papers ...
• From Julapa Jagtiani and William W. Lang at the Philly Fed: Strategic Default on First and Second Lien Mortgages During the Financial Crisis
The researchers look at the data and notice that a large percentage of borrowers who are in default on their first mortgage and still making payments on their 2nd. They ask "Why might households default on their first mortgage but not default on their home equity loans?"
They offer several explanations, and conclude:
Our results overall suggest that people default strategically as their home value falls below the mortgage value; they exercise the put option to default on their first mortgage. However, they tend to keep their HELOCs current in order to maintain the credit line available to them, particularly for those who have already used their credit card lines.Another possible explanation that the authors didn't explore is that the 2nd is recourse, and the borrower has sufficient other assets and believes the 2nd lender will pursue them.
• From Christopher M. James as the SF Fed: Mortgage-Backed Securities: How Important Is “Skin in the Game”?
This economic letter explores the importance of lenders having "skin in the game". The recent financial regulation require securitizers to retain at least 5% of the credit risk for residential MBS. The author looks at several deals where the originator had some risk (through affiliated deals) and concludes:
Overall, these results suggest significant performance differences based on the loss exposure of the mortgage originator. In short, skin in the game matters for performance. More important, because in this study the residual interest retained by the sponsor is 3% or less of the total value of the securitization, these findings suggest that a 5% loss exposure requirement is likely to have a significant impact on loss rates.This appears to support the "skin in the game" requirement.


